|
Ealing Southall
Labour hold

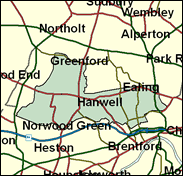
Piara Khabra, born in 1924, or possibly 1922 according to report, will be the oldest member in the next House of Commons. His constituency almost certainly has the highest proportion of Asian voters in London, a near majority. Southall has come to be seen as a Little India in west London, with street markets, restaurants, sari and sweet shops, and banks all reflecting the varied cultures of the sub-continent. Northcote and Glebe wards are the most heavily non-white in Greater London at the time of the 1991 Census, the latest taken, at 90pc and 81pc respectively. Mount Pleasant and Dormers Wells are also well over half Asian. As might be expected given the current loyalty of the Asian vote to Labour (surely with Asian family and business values the Tories should do better, but very unfortunately, or perhaps foolishly, they have come to be associated with racial discriminatory views) Khabra's vote piles up, reaching nearly 33,000 in 1997. This is a much larger than average seat, but the turnout is only typical for London. Although some voters will eventually be lost in boundary changes, these are not due until well after the next General Election, and in any case will be unlikely to break up this large and influential bloc of ethnic voters, here by then a majority rather than a minority.

Slight, balding and ungregarious Piara Khabra, Labour's oldest MP (born 1922 in the Punjab) came to Britain in 1959 to work at the local rubber factory which was at the centre of the "Asianisation" of Southall at that time. A hot-tempered if mild-looking secular Sikh, he qualified as a teacher at Whitelands College, Putney, and taught for 14 years before concentrating on ward heeling among the Southall Indian community as a community worker, and eventually securing the deselection of the veteran Labour MP Syd Bidwell. Elected in 1992, he is a rare Commons performer. A campaigner on euthanasia, he also focuses on immigration issues concerning his Asian voters.
 |
| Wealthy Achievers, Suburban Areas |
1.85% |
14.99% |
12.34 |
|
| Affluent Greys, Rural Communities |
0.00% |
2.13% |
0.00 |
|
| Prosperous Pensioners, Retirement Areas |
0.24% |
2.49% |
9.60 |
|
| Affluent Executives, Family Areas |
0.00% |
4.43% |
0.00 |
|
| Well-Off Workers, Family Areas |
0.00% |
7.27% |
0.00 |
|
| Affluent Urbanites, Town & City Areas |
7.03% |
2.56% |
274.02 |
|
| Prosperous Professionals, Metropolitan Areas |
22.57% |
2.04% |
1,105.82 |
|
| Better-Off Executives, Inner City Areas |
8.42% |
3.94% |
213.56 |
|
| Comfortable Middle Agers, Mature Home Owning Areas |
0.04% |
13.04% |
0.29 |
|
| Skilled Workers, Home Owning Areas |
1.21% |
12.70% |
9.54 |
|
| New Home Owners, Mature Communities |
0.03% |
8.14% |
0.31 |
|
| White Collar Workers, Better-Off Multi Ethnic Areas |
16.93% |
4.02% |
420.90 |
|
| Older People, Less Prosperous Areas |
0.00% |
3.19% |
0.00 |
|
| Council Estate Residents, Better-Off Homes |
2.34% |
11.31% |
20.73 |
|
| Council Estate Residents, High Unemployment |
3.85% |
3.06% |
125.68 |
|
| Council Estate Residents, Greatest Hardship |
0.55% |
2.52% |
21.74 |
|
| People in Multi-Ethnic, Low-Income Areas |
34.93% |
2.10% |
1,663.39 |
|
| Unclassified |
0.02% |
0.06% |
27.81 |
|
|
 |
 |
 |
| £0-5K |
5.18% |
9.41% |
55.01 |
|
| £5-10K |
10.76% |
16.63% |
64.67 |
|
| £10-15K |
12.85% |
16.58% |
77.49 |
|
| £15-20K |
12.33% |
13.58% |
90.79 |
|
| £20-25K |
10.77% |
10.39% |
103.62 |
|
| £25-30K |
8.99% |
7.77% |
115.59 |
|
| £30-35K |
7.33% |
5.79% |
126.59 |
|
| £35-40K |
5.92% |
4.33% |
136.61 |
|
| £40-45K |
4.76% |
3.27% |
145.70 |
|
| £45-50K |
3.82% |
2.48% |
153.92 |
|
| £50-55K |
3.07% |
1.90% |
161.36 |
|
| £55-60K |
2.48% |
1.47% |
168.10 |
|
| £60-65K |
2.01% |
1.15% |
174.22 |
|
| £65-70K |
1.63% |
0.91% |
179.78 |
|
| £70-75K |
1.33% |
0.72% |
184.83 |
|
| £75-80K |
1.09% |
0.57% |
189.44 |
|
| £80-85K |
0.90% |
0.46% |
193.66 |
|
| £85-90K |
0.74% |
0.37% |
197.51 |
|
| £90-95K |
0.61% |
0.31% |
201.05 |
|
| £95-100K |
0.51% |
0.25% |
204.29 |
|
| £100K + |
2.94% |
1.34% |
218.46 |
|
|
|

|


|
1992-1997
|
1997-2001
|
|
|
|
| Con |
-15.50% |
| Lab |
14.71% |
| LD |
2.21% |
|
| Con |
-2.53% |
| Lab |
-12.52% |
| LD |
-0.41% |
|
|
 |
Piara S Khabra
Labour hold
|
| Con |
 |
8,556 |
18.27% |
| Lab |
 |
22,239 |
47.49% |
| LD |
 |
4,680 |
9.99% |
| Oth |
 |
11,353 |
24.24% |
| Maj |
 |
13,683 |
29.22% |
| Turn |
 |
46,828 |
56.85% |
|
|
 |
Piara S Khabra
Labour hold
|
| Qari |
Mohammed Bhutta |
169 |
0.36% |
| SL |
Harpal Brar |
921 |
1.97% |
| I |
Mushtaq Choudhry |
1,166 |
2.49% |
| G |
Jane Cook |
2,119 |
4.53% |
| Com |
Salvinder Dhillon |
1,214 |
2.59% |
| C |
Daniel Kawczynski |
8,556 |
18.27% |
| L |
Piara S Khabra |
22,239 |
47.49% |
| Sunrise |
Avtar Lit |
5,764 |
12.31% |
| LD |
Baldev Sharma |
4,680 |
9.99% |
|
Candidates representing 9 parties stood for election to this seat.
|
|
 |
Piara Khambra
Labour
|
| Con |
 |
11,368 |
20.80% |
| Lab |
 |
32,791 |
60.01% |
| LD |
 |
5,687 |
10.41% |
| Ref |
 |
854 |
1.56% |
| Oth |
 |
3,942 |
7.21% |
| Maj |
 |
21,423 |
39.21% |
| Turn |
 |
54,642 |
66.88% |
|
|
 |
|
Labour
|
| Con |
 |
20,340 |
36.30% |
| Lab |
 |
25,371 |
45.30% |
| LD |
 |
4,567 |
8.20% |
| Oth |
 |
5,753 |
10.30% |
| Maj |
 |
5,031 |
9.00% |
| Turn |
 |
56,031 |
74.27% |
|
|
 |
|

|

