|
Easington
Labour hold

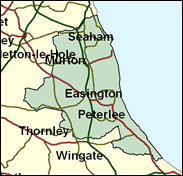
One of Labour's strongest of all traditional strongholds, this was the seat of Manny Shinwell, an MP who first entered Parliament in 1922, defeated Ramsay MacDonald, his party's first ever Prime Minister in 1935 in Seaham (MacDonald had "betrayed" Labour by forming a coalition National government in the 1931 economic crisis), and was MP for Easington from its creation in 1950 to 1970, when he was well over 80 years of age. Shinwell went to the Lords, and remained active in his Labour's interest even as a centenarian. Easington still includes Seaham Harbour, along with big ex-colliery villages like Murton, Horden and Easington itself, whose pit workings extended far out below the North Sea. The New Town of Peterlee is also to be found here in east County Durham, but even its connections with age old tradition are apparent in its name: Peter Lee was the Durham-born international miners' union leader. In 1997 this seat produced Labour's second biggest numerical majority after Knowsley South, and its second biggest percentage majority after another Merseyside constituency, Bootle.

John Cummings, a fifth generation child of the pits, is now one of only 12 remaining former NUM-sponsored MPs, having worked for 30 years as a pit electrician before being elected here in 1987. Born in 1943 and locally educated at Murton schools and Easington Technical College, he spent 17 years on the local council, 10 as leader, and was a Whip at Westminster for three years before being dropped by Blair on the morrow of victory in 1997. Though a leftwing defender of the dying coal industry and of a Palestinian state, he has rebelled only modestly against the Blair government, on the Prime Minister's power to nominate life peers and on disability benefit cuts. As a Catholic he backs curbs on abortion and embryo research.
 |
| Wealthy Achievers, Suburban Areas |
1.69% |
14.99% |
11.25 |
|
| Affluent Greys, Rural Communities |
0.04% |
2.13% |
1.96 |
|
| Prosperous Pensioners, Retirement Areas |
0.00% |
2.49% |
0.00 |
|
| Affluent Executives, Family Areas |
1.65% |
4.43% |
37.36 |
|
| Well-Off Workers, Family Areas |
8.71% |
7.27% |
119.70 |
|
| Affluent Urbanites, Town & City Areas |
0.00% |
2.56% |
0.00 |
|
| Prosperous Professionals, Metropolitan Areas |
0.00% |
2.04% |
0.00 |
|
| Better-Off Executives, Inner City Areas |
0.22% |
3.94% |
5.62 |
|
| Comfortable Middle Agers, Mature Home Owning Areas |
1.65% |
13.04% |
12.68 |
|
| Skilled Workers, Home Owning Areas |
33.97% |
12.70% |
267.45 |
|
| New Home Owners, Mature Communities |
14.92% |
8.14% |
183.26 |
|
| White Collar Workers, Better-Off Multi Ethnic Areas |
0.00% |
4.02% |
0.00 |
|
| Older People, Less Prosperous Areas |
5.21% |
3.19% |
163.60 |
|
| Council Estate Residents, Better-Off Homes |
27.33% |
11.31% |
241.63 |
|
| Council Estate Residents, High Unemployment |
0.21% |
3.06% |
6.91 |
|
| Council Estate Residents, Greatest Hardship |
4.39% |
2.52% |
174.15 |
|
| People in Multi-Ethnic, Low-Income Areas |
0.00% |
2.10% |
0.00 |
|
| Unclassified |
0.00% |
0.06% |
0.00 |
|
|
 |
 |
 |
| £0-5K |
14.70% |
9.41% |
156.12 |
|
| £5-10K |
24.89% |
16.63% |
149.63 |
|
| £10-15K |
20.74% |
16.58% |
125.11 |
|
| £15-20K |
13.87% |
13.58% |
102.11 |
|
| £20-25K |
8.74% |
10.39% |
84.10 |
|
| £25-30K |
5.49% |
7.77% |
70.65 |
|
| £30-35K |
3.51% |
5.79% |
60.65 |
|
| £35-40K |
2.30% |
4.33% |
53.16 |
|
| £40-45K |
1.55% |
3.27% |
47.44 |
|
| £45-50K |
1.07% |
2.48% |
42.98 |
|
| £50-55K |
0.75% |
1.90% |
39.45 |
|
| £55-60K |
0.54% |
1.47% |
36.58 |
|
| £60-65K |
0.39% |
1.15% |
34.21 |
|
| £65-70K |
0.29% |
0.91% |
32.22 |
|
| £70-75K |
0.22% |
0.72% |
30.53 |
|
| £75-80K |
0.17% |
0.57% |
29.07 |
|
| £80-85K |
0.13% |
0.46% |
27.79 |
|
| £85-90K |
0.10% |
0.37% |
26.66 |
|
| £90-95K |
0.08% |
0.31% |
25.65 |
|
| £95-100K |
0.06% |
0.25% |
24.75 |
|
| £100K + |
0.28% |
1.34% |
20.79 |
|
|
|

|


|
1992-1997
|
1997-2001
|
|
|
|
| Con |
-8.14% |
| Lab |
7.50% |
| LD |
-3.38% |
|
| Con |
1.77% |
| Lab |
-3.38% |
| LD |
3.10% |
|
|
 |
John Cummings
Labour hold
|
| Con |
 |
3,411 |
10.33% |
| Lab |
 |
25,360 |
76.83% |
| LD |
 |
3,408 |
10.32% |
| Oth |
 |
831 |
2.52% |
| Maj |
 |
21,949 |
66.49% |
| Turn |
 |
33,010 |
53.65% |
|
|
 |
John Cummings
Labour hold
|
| L |
John Cummings |
25,360 |
76.83% |
| C |
Philip Lovel |
3,411 |
10.33% |
| LD |
Christopher Ord |
3,408 |
10.32% |
| SL |
Dave Robinson |
831 |
2.52% |
|
Candidates representing 4 parties stood for election to this seat.
|
|
 |
John Cummings
Labour
|
| Con |
 |
3,588 |
8.56% |
| Lab |
 |
33,600 |
80.20% |
| LD |
 |
3,025 |
7.22% |
| Ref |
 |
1,179 |
2.81% |
| Oth |
 |
503 |
1.20% |
| Maj |
 |
30,012 |
71.64% |
| Turn |
 |
41,895 |
67.01% |
|
|
 |
|
Labour
|
| Con |
 |
7,879 |
16.70% |
| Lab |
 |
34,269 |
72.70% |
| LD |
 |
5,001 |
10.60% |
| Oth |
|
0 |
0.00% |
| Maj |
 |
26,390 |
56.00% |
| Turn |
 |
47,149 |
71.61% |
|
|
 |
|

|

