|
East Ham
Labour hold

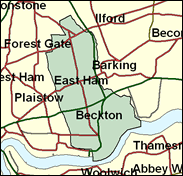
East Ham, which is basically the Newham North East which existed until 1997, is a mixed race seat at the heart of the east end of London, won by Stephen Timms in a by-election in 1994 and very safely retained in the last General Election. An interesting feature in that contest, which was not close, was that fringe parties of the extreme Left and Right between tham polled exactly 10pc of the vote, the highest anywhere in England. Socialist Labour (the party founded by Arthur Scargill) saved their deposit and the British National Party exploited reaction against the 49pc non-white population here with a 3pc haul. This hardly makes East Ham a hotbed of extremism but does say something about the tensions and discontents generated in one of the less affluent parts of a very wealthy big city.

Stephen Timms, a tall, pudding-basin-hair-cut-sporting Europhile, computer specialist and Christian Socialist, won here in 1994, having run the local council for 4 years. Born 1955, educated at Farnborough Grammar School and Emmanuel College. Cambridge, with his very long head and high forehead and fringe, he has the appearance of a grown-up Midwich Cuckoo. Mild, earnest, idealistic and uncharismatic, he has risen swiftly in government since 1998, currently as Financial Secretary to the Treasury.
 |
| Wealthy Achievers, Suburban Areas |
0.00% |
14.99% |
0.00 |
|
| Affluent Greys, Rural Communities |
0.00% |
2.13% |
0.00 |
|
| Prosperous Pensioners, Retirement Areas |
0.00% |
2.49% |
0.00 |
|
| Affluent Executives, Family Areas |
0.70% |
4.43% |
15.72 |
|
| Well-Off Workers, Family Areas |
0.00% |
7.27% |
0.05 |
|
| Affluent Urbanites, Town & City Areas |
3.90% |
2.56% |
152.26 |
|
| Prosperous Professionals, Metropolitan Areas |
0.00% |
2.04% |
0.00 |
|
| Better-Off Executives, Inner City Areas |
1.01% |
3.94% |
25.55 |
|
| Comfortable Middle Agers, Mature Home Owning Areas |
0.00% |
13.04% |
0.00 |
|
| Skilled Workers, Home Owning Areas |
8.52% |
12.70% |
67.07 |
|
| New Home Owners, Mature Communities |
0.38% |
8.14% |
4.63 |
|
| White Collar Workers, Better-Off Multi Ethnic Areas |
24.72% |
4.02% |
614.77 |
|
| Older People, Less Prosperous Areas |
1.07% |
3.19% |
33.58 |
|
| Council Estate Residents, Better-Off Homes |
3.74% |
11.31% |
33.03 |
|
| Council Estate Residents, High Unemployment |
8.80% |
3.06% |
287.27 |
|
| Council Estate Residents, Greatest Hardship |
2.22% |
2.52% |
88.11 |
|
| People in Multi-Ethnic, Low-Income Areas |
44.95% |
2.10% |
2,140.31 |
|
| Unclassified |
0.00% |
0.06% |
0.00 |
|
|
 |
 |
 |
| £0-5K |
9.09% |
9.41% |
96.57 |
|
| £5-10K |
15.57% |
16.63% |
93.59 |
|
| £10-15K |
15.98% |
16.58% |
96.40 |
|
| £15-20K |
13.55% |
13.58% |
99.73 |
|
| £20-25K |
10.65% |
10.39% |
102.51 |
|
| £25-30K |
8.13% |
7.77% |
104.53 |
|
| £30-35K |
6.13% |
5.79% |
105.87 |
|
| £35-40K |
4.62% |
4.33% |
106.63 |
|
| £40-45K |
3.49% |
3.27% |
106.94 |
|
| £45-50K |
2.65% |
2.48% |
106.90 |
|
| £50-55K |
2.03% |
1.90% |
106.60 |
|
| £55-60K |
1.56% |
1.47% |
106.11 |
|
| £60-65K |
1.21% |
1.15% |
105.47 |
|
| £65-70K |
0.95% |
0.91% |
104.74 |
|
| £70-75K |
0.75% |
0.72% |
103.93 |
|
| £75-80K |
0.59% |
0.57% |
103.08 |
|
| £80-85K |
0.47% |
0.46% |
102.19 |
|
| £85-90K |
0.38% |
0.37% |
101.30 |
|
| £90-95K |
0.31% |
0.31% |
100.39 |
|
| £95-100K |
0.25% |
0.25% |
99.49 |
|
| £100K + |
1.26% |
1.34% |
93.61 |
|
|
|

|


|
1992-1997
|
1997-2001
|
|
|
|
| Con |
-15.90% |
| Lab |
10.63% |
| LD |
-7.58% |
|
| Con |
0.76% |
| Lab |
9.33% |
| LD |
0.54% |
|
|
 |
Stephen Timms
Labour hold
|
| Con |
 |
6,209 |
16.86% |
| Lab |
 |
27,241 |
73.96% |
| LD |
 |
2,600 |
7.06% |
| Oth |
 |
783 |
2.13% |
| Maj |
 |
21,032 |
57.10% |
| Turn |
 |
36,833 |
51.69% |
|
|
 |
Stephen Timms
Labour hold
|
| C |
Peter Campbell |
6,209 |
16.86% |
| SL |
Rod Finlayson |
783 |
2.13% |
| LD |
Bridget Fox |
2,600 |
7.06% |
| L |
Stephen Timms |
27,241 |
73.96% |
|
Candidates representing 4 parties stood for election to this seat.
|
|
 |
Stephen Timms
Labour
|
| Con |
 |
6,421 |
16.10% |
| Lab |
 |
25,779 |
64.63% |
| LD |
 |
2,599 |
6.52% |
| Ref |
 |
845 |
2.12% |
| Oth |
 |
4,245 |
10.64% |
| Maj |
 |
19,358 |
48.53% |
| Turn |
 |
39,889 |
60.81% |
|
|
 |
|
Labour
|
| Con |
 |
13,751 |
32.00% |
| Lab |
 |
23,212 |
54.00% |
| LD |
 |
6,049 |
14.10% |
| Oth |
|
0 |
0.00% |
| Maj |
 |
9,461 |
22.00% |
| Turn |
 |
43,012 |
61.66% |
|
|
 |
|

|

