|
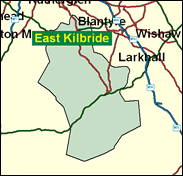
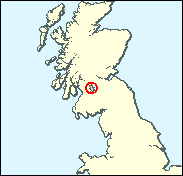
East Kilbride
Labour hold

A post war new town south of Glasgow, East Kilbride has had its own parliamentary constituency since 1974. It has always been held by Labour, but strong challenges were posed by the SNP in 1974 and the SDP in 1983. Maybe the fact that so many of the voters must have been migrants (almost all from other parts of Scotland) may have stimulated a certain rootless volatility, but things have settled down and in 1997 Adam Ingram recorded East Kilbride's highest ever majority by far, over 17,000. That the nationalists are in a very clear second (that is, virtually no chance of winning) was confirmed in the elections of May 1999 for the new Scottish Parliament.

Adam Ingram, stuck in the saltmines as a Northern Ireland Minister since 1997, is a behind-the-scenes-fixer who filled in a good deal of the detail behind the erratic broad brush yet universally admired facade of Mo Mowlam. Born 1947 and educated at Cranhill Secondary School, Glasgow, and originally a computer programmer-turned-NALGO official, he was elected here in 1987, rose as Neil Kinnock's PPS, and exhibits the snub-nosed pugnacity, if not the Catholicism, of many of his West of Scotland Labour contemporaries.
 |
| Wealthy Achievers, Suburban Areas |
6.35% |
14.99% |
42.37 |
|
| Affluent Greys, Rural Communities |
0.36% |
2.13% |
17.06 |
|
| Prosperous Pensioners, Retirement Areas |
0.64% |
2.49% |
25.77 |
|
| Affluent Executives, Family Areas |
8.48% |
4.43% |
191.67 |
|
| Well-Off Workers, Family Areas |
7.95% |
7.27% |
109.35 |
|
| Affluent Urbanites, Town & City Areas |
3.77% |
2.56% |
146.96 |
|
| Prosperous Professionals, Metropolitan Areas |
0.24% |
2.04% |
11.90 |
|
| Better-Off Executives, Inner City Areas |
0.72% |
3.94% |
18.37 |
|
| Comfortable Middle Agers, Mature Home Owning Areas |
1.70% |
13.04% |
13.04 |
|
| Skilled Workers, Home Owning Areas |
19.27% |
12.70% |
151.73 |
|
| New Home Owners, Mature Communities |
3.67% |
8.14% |
45.12 |
|
| White Collar Workers, Better-Off Multi Ethnic Areas |
0.20% |
4.02% |
5.06 |
|
| Older People, Less Prosperous Areas |
10.50% |
3.19% |
329.52 |
|
| Council Estate Residents, Better-Off Homes |
29.62% |
11.31% |
261.86 |
|
| Council Estate Residents, High Unemployment |
5.58% |
3.06% |
182.13 |
|
| Council Estate Residents, Greatest Hardship |
0.93% |
2.52% |
36.89 |
|
| People in Multi-Ethnic, Low-Income Areas |
0.00% |
2.10% |
0.00 |
|
| Unclassified |
0.00% |
0.06% |
0.00 |
|
|
 |
 |
 |
| £0-5K |
7.95% |
9.41% |
84.44 |
|
| £5-10K |
16.02% |
16.63% |
96.33 |
|
| £10-15K |
16.96% |
16.58% |
102.28 |
|
| £15-20K |
14.29% |
13.58% |
105.20 |
|
| £20-25K |
11.05% |
10.39% |
106.32 |
|
| £25-30K |
8.27% |
7.77% |
106.38 |
|
| £30-35K |
6.13% |
5.79% |
105.79 |
|
| £35-40K |
4.54% |
4.33% |
104.76 |
|
| £40-45K |
3.38% |
3.27% |
103.46 |
|
| £45-50K |
2.53% |
2.48% |
101.97 |
|
| £50-55K |
1.91% |
1.90% |
100.34 |
|
| £55-60K |
1.45% |
1.47% |
98.63 |
|
| £60-65K |
1.12% |
1.15% |
96.86 |
|
| £65-70K |
0.86% |
0.91% |
95.04 |
|
| £70-75K |
0.67% |
0.72% |
93.21 |
|
| £75-80K |
0.53% |
0.57% |
91.36 |
|
| £80-85K |
0.41% |
0.46% |
89.52 |
|
| £85-90K |
0.33% |
0.37% |
87.68 |
|
| £90-95K |
0.26% |
0.31% |
85.87 |
|
| £95-100K |
0.21% |
0.25% |
84.07 |
|
| £100K + |
0.98% |
1.34% |
72.60 |
|
|
|

|


|
1992-1997
|
1997-2001
|
|
|
|
| Con |
-6.58% |
| Lab |
9.13% |
| LD |
-3.17% |
| SNP |
-2.70% |
|
| Con |
-1.85% |
| Lab |
-3.27% |
| LD |
3.03% |
| SNP |
1.76% |
|
|
 |
Adam Ingram
Labour hold
|
| Con |
 |
4,238 |
10.17% |
| Lab |
 |
22,205 |
53.26% |
| LD |
 |
4,278 |
10.26% |
| SNP |
 |
9,450 |
22.67% |
| Oth |
 |
1,519 |
3.64% |
| Maj |
 |
12,755 |
30.59% |
| Turn |
 |
41,690 |
62.62% |
|
|
 |
Adam Ingram
Labour hold
|
| SNP |
Archie Buchanan |
9,450 |
22.67% |
| LD |
Ewan Hawthorn |
4,278 |
10.26% |
| L |
Adam Ingram |
22,205 |
53.26% |
| C |
Margaret McCulloch |
4,238 |
10.17% |
| SSP |
David Stevenson |
1,519 |
3.64% |
|
Candidates representing 5 parties stood for election to this seat.
|
|
 |
Adam Ingram
Labour
|
| Con |
 |
5,863 |
12.02% |
| Lab |
 |
27,584 |
56.53% |
| LD |
 |
3,527 |
7.23% |
| SNP |
 |
10,200 |
20.90% |
| Ref |
 |
306 |
0.63% |
| Oth |
 |
1,316 |
2.70% |
| Maj |
 |
17,384 |
35.63% |
| Turn |
 |
48,796 |
74.81% |
|
|
 |
|
Labour
|
| Con |
 |
9,365 |
18.60% |
| Lab |
 |
23,795 |
47.40% |
| LD |
 |
5,221 |
10.40% |
| SNP |
 |
11,855 |
23.60% |
| Oth |
|
0 |
0.00% |
| Maj |
 |
11,940 |
23.80% |
| Turn |
 |
50,236 |
79.08% |
|
|
 |
|

|

