|
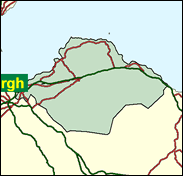
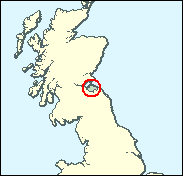
East Lothian
Labour hold

John Home Robertson has held East Lothian since won a by-election in 1978 - never a trivial task when one's party is in government, particularly when it's heading for disaster the next year. This was even more impressive, for at that time the seat included the small but non-industrial Berwickshire, which was not removed until 1983 boundary changes. Labour still does better the closer one approaches Edinburgh, but the solidly working class communities like Tranent, Ormiston and Prestonpans out vote more Conservative and rural territory like Dunbar, Haddington and North Berwick. The difference can be seen as one travels on the main London Kings Cross to Edinburgh Waverley train (with more time to analyse it on recent journeys). The Conservatives have never shown they can win this seat, and indeed slipped to third in the inaugural Scottish parliament elections in 1999.

Ann Picking, a Kent-based Scot returning to Scotland, is a former nurse who has risen in the Labour Party via the union route, in her case UNISON, which she has represented on Labour's NEC since 1997, as well as chairing the Party's Organisation committee. Born in 1958 and educated at Woodmill High School, Dunfermline, she became a nurse, joined COHSE in 1975 and rose through its ranks, eventually reaching COHSE/UNISON's NEC. Living in Kent from the mid-1980s, she worked with management to save staff jobs in a switch from hospital to community care provision, and became an Ashford Borough Councillor in 1995. She claims to thrive on campaigning and taking on Tories, and to have addressed 10,000 people in Hyde Park.
 |
| Wealthy Achievers, Suburban Areas |
13.02% |
14.99% |
86.85 |
|
| Affluent Greys, Rural Communities |
2.23% |
2.13% |
104.72 |
|
| Prosperous Pensioners, Retirement Areas |
2.73% |
2.49% |
109.87 |
|
| Affluent Executives, Family Areas |
4.03% |
4.43% |
91.15 |
|
| Well-Off Workers, Family Areas |
7.33% |
7.27% |
100.81 |
|
| Affluent Urbanites, Town & City Areas |
3.21% |
2.56% |
125.07 |
|
| Prosperous Professionals, Metropolitan Areas |
0.34% |
2.04% |
16.70 |
|
| Better-Off Executives, Inner City Areas |
0.26% |
3.94% |
6.48 |
|
| Comfortable Middle Agers, Mature Home Owning Areas |
7.41% |
13.04% |
56.79 |
|
| Skilled Workers, Home Owning Areas |
6.19% |
12.70% |
48.69 |
|
| New Home Owners, Mature Communities |
14.30% |
8.14% |
175.65 |
|
| White Collar Workers, Better-Off Multi Ethnic Areas |
1.38% |
4.02% |
34.37 |
|
| Older People, Less Prosperous Areas |
5.07% |
3.19% |
159.06 |
|
| Council Estate Residents, Better-Off Homes |
24.77% |
11.31% |
218.99 |
|
| Council Estate Residents, High Unemployment |
3.26% |
3.06% |
106.54 |
|
| Council Estate Residents, Greatest Hardship |
4.47% |
2.52% |
177.65 |
|
| People in Multi-Ethnic, Low-Income Areas |
0.00% |
2.10% |
0.00 |
|
| Unclassified |
0.00% |
0.06% |
0.00 |
|
|
 |
|
|
| £0-5K |
8.26% |
9.41% |
87.79 |
|
| £5-10K |
15.62% |
16.63% |
93.89 |
|
| £10-15K |
16.32% |
16.58% |
98.46 |
|
| £15-20K |
13.82% |
13.58% |
101.75 |
|
| £20-25K |
10.81% |
10.39% |
103.99 |
|
| £25-30K |
8.20% |
7.77% |
105.46 |
|
| £30-35K |
6.16% |
5.79% |
106.36 |
|
| £35-40K |
4.63% |
4.33% |
106.84 |
|
| £40-45K |
3.50% |
3.27% |
107.04 |
|
| £45-50K |
2.66% |
2.48% |
107.04 |
|
| £50-55K |
2.04% |
1.90% |
106.89 |
|
| £55-60K |
1.57% |
1.47% |
106.64 |
|
| £60-65K |
1.22% |
1.15% |
106.32 |
|
| £65-70K |
0.96% |
0.91% |
105.96 |
|
| £70-75K |
0.76% |
0.72% |
105.57 |
|
| £75-80K |
0.60% |
0.57% |
105.16 |
|
| £80-85K |
0.48% |
0.46% |
104.75 |
|
| £85-90K |
0.39% |
0.37% |
104.33 |
|
| £90-95K |
0.32% |
0.31% |
103.92 |
|
| £95-100K |
0.26% |
0.25% |
103.51 |
|
| £100K + |
1.36% |
1.34% |
100.92 |
|
|
|
|


|
1992-1997
|
1997-2001
|
|
|
|
| Con |
-10.26% |
| Lab |
7.18% |
| LD |
-0.57% |
| SNP |
2.41% |
|
| Con |
-2.10% |
| Lab |
-5.47% |
| LD |
7.11% |
| SNP |
-1.12% |
|
|
|
Anne Picking
Labour hold
|
| Con |
 |
6,577 |
17.84% |
| Lab |
 |
17,407 |
47.21% |
| LD |
 |
6,506 |
17.65% |
| SNP |
 |
5,381 |
14.59% |
| Oth |
 |
1,000 |
2.71% |
| Maj |
 |
10,830 |
29.37% |
| Turn |
|
36,871 |
62.51% |
|
|
|
Anne Picking
Labour hold
|
| SNP |
Hilary Brown |
5,381 |
14.59% |
| LD |
Judy Hayman |
6,506 |
17.65% |
| SL |
Jake Herriot |
624 |
1.69% |
| C |
Hamish Mair |
6,577 |
17.84% |
| L |
Anne Picking |
17,407 |
47.21% |
| SSP |
Derrick White |
376 |
1.02% |
|
Candidates representing 6 parties stood for election to this seat.
|
|
|
John Home Robertson
Labour
|
| Con |
|
8,660 |
19.94% |
| Lab |
|
22,881 |
52.68% |
| LD |
|
4,575 |
10.53% |
| SNP |
|
6,825 |
15.71% |
| Ref |
 |
491 |
1.13% |
| Oth |
|
0 |
0.00% |
| Maj |
|
14,221 |
32.74% |
| Turn |
|
43,432 |
75.61% |
|
|
|
|
Labour
|
| Con |
|
14,024 |
30.20% |
| Lab |
|
21,123 |
45.50% |
| LD |
|
5,147 |
11.10% |
| SNP |
|
6,171 |
13.30% |
| Oth |
|
0 |
0.00% |
| Maj |
|
7,099 |
15.30% |
| Turn |
|
46,465 |
82.56% |
|
|
|
|
|