|
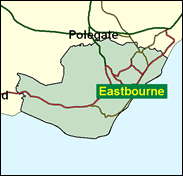
Eastbourne
Conservative hold

Apart from a by-election following the murder of Ian Gow in 1990, Eastbourne has largely avoided the drift away from the Conservatives found in so many less genteel south coast seaside resorts, and despite a tradition of Liberal Democrat local activism here they seem in relatively good shape; for example, they outpolled the Liberal Democrats by 36pc in the European elections here in 1999 and on stronger ground for their main opponents they were nearly 20pc clear in the May 2000 elections in Eastbourne Borough, in all probability the last test of public opinion before the next General Election. 56.5 pc of those on the electoral roll in Eastbourne are over 50 years of age, the third highest of the 26 in all where a majority are of this age; 15 are currently Tory, seven Labour and four Liberal Democrat. A sign of "grey power" is that the top five on the list are all classed as marginals: Christchurch, Harwich, Eastbourne, Norfolk North and Totnes. All politicians shoud be very aware that there is no maximum age for voting.

Burly, mild-looking solicitor, Nigel Waterson, Conservative environment spokesman, was born in 1950 and educated at Leeds Grammar School and Queen's College, Oxford. A mainstream Eurosceptic loyalist, he campaigns against his town's downward mobility, as hotels convert to DSS hostels or berths for dispersed asylum seekers, and against the locally-prominent Lib Dems, whose MP David Bellotti he ousted in 1992. His conventional rise in the Tory party was via law and order conference speeches. He wavered in the leadership ballots in 1997 between Redwood and Hague, but voted for Lilley. His current spokesmanship involves him opposing housing sprawl in the Tory shires.
 |
| Wealthy Achievers, Suburban Areas |
9.49% |
14.99% |
63.28 |
|
| Affluent Greys, Rural Communities |
0.28% |
2.13% |
13.28 |
|
| Prosperous Pensioners, Retirement Areas |
25.82% |
2.49% |
1,038.48 |
|
| Affluent Executives, Family Areas |
1.99% |
4.43% |
44.87 |
|
| Well-Off Workers, Family Areas |
2.12% |
7.27% |
29.17 |
|
| Affluent Urbanites, Town & City Areas |
1.06% |
2.56% |
41.48 |
|
| Prosperous Professionals, Metropolitan Areas |
0.04% |
2.04% |
1.80 |
|
| Better-Off Executives, Inner City Areas |
6.46% |
3.94% |
163.78 |
|
| Comfortable Middle Agers, Mature Home Owning Areas |
18.32% |
13.04% |
140.48 |
|
| Skilled Workers, Home Owning Areas |
6.70% |
12.70% |
52.75 |
|
| New Home Owners, Mature Communities |
9.21% |
8.14% |
113.11 |
|
| White Collar Workers, Better-Off Multi Ethnic Areas |
5.59% |
4.02% |
139.12 |
|
| Older People, Less Prosperous Areas |
4.70% |
3.19% |
147.67 |
|
| Council Estate Residents, Better-Off Homes |
6.55% |
11.31% |
57.89 |
|
| Council Estate Residents, High Unemployment |
0.54% |
3.06% |
17.53 |
|
| Council Estate Residents, Greatest Hardship |
1.10% |
2.52% |
43.51 |
|
| People in Multi-Ethnic, Low-Income Areas |
0.00% |
2.10% |
0.00 |
|
| Unclassified |
0.03% |
0.06% |
55.82 |
|
|
 |
 |
 |
| £0-5K |
10.08% |
9.41% |
107.13 |
|
| £5-10K |
18.67% |
16.63% |
112.24 |
|
| £10-15K |
18.14% |
16.58% |
109.39 |
|
| £15-20K |
14.15% |
13.58% |
104.16 |
|
| £20-25K |
10.27% |
10.39% |
98.84 |
|
| £25-30K |
7.32% |
7.77% |
94.15 |
|
| £30-35K |
5.22% |
5.79% |
90.18 |
|
| £35-40K |
3.76% |
4.33% |
86.84 |
|
| £40-45K |
2.74% |
3.27% |
84.03 |
|
| £45-50K |
2.03% |
2.48% |
81.64 |
|
| £50-55K |
1.52% |
1.90% |
79.56 |
|
| £55-60K |
1.15% |
1.47% |
77.74 |
|
| £60-65K |
0.88% |
1.15% |
76.13 |
|
| £65-70K |
0.68% |
0.91% |
74.67 |
|
| £70-75K |
0.53% |
0.72% |
73.35 |
|
| £75-80K |
0.41% |
0.57% |
72.13 |
|
| £80-85K |
0.33% |
0.46% |
71.01 |
|
| £85-90K |
0.26% |
0.37% |
69.97 |
|
| £90-95K |
0.21% |
0.31% |
68.99 |
|
| £95-100K |
0.17% |
0.25% |
68.07 |
|
| £100K + |
0.85% |
1.34% |
63.08 |
|
|
|

|


|
1992-1997
|
1997-2001
|
|
|
|
| Con |
-10.88% |
| Lab |
7.79% |
| LD |
-2.87% |
|
| Con |
1.97% |
| Lab |
0.84% |
| LD |
0.94% |
|
|
 |
Nigel Waterson
Conservative hold
|
| Con |
 |
19,738 |
44.09% |
| Lab |
 |
5,967 |
13.33% |
| LD |
 |
17,584 |
39.28% |
| Oth |
 |
1,481 |
3.31% |
| Maj |
 |
2,154 |
4.81% |
| Turn |
 |
44,770 |
60.68% |
|
|
 |
Nigel Waterson
Conservative hold
|
| LD |
Chris Berry |
17,584 |
39.28% |
| UK |
Barry Jones |
907 |
2.03% |
| L |
Gillian Roles |
5,967 |
13.33% |
| C |
Nigel Waterson |
19,738 |
44.09% |
| Lib |
Maria Williamson |
574 |
1.28% |
|
Candidates representing 5 parties stood for election to this seat.
|
|
 |
Nigel Waterson
Conservative
|
| Con |
 |
22,183 |
42.12% |
| Lab |
 |
6,576 |
12.49% |
| LD |
 |
20,189 |
38.33% |
| Ref |
 |
2,724 |
5.17% |
| Oth |
 |
995 |
1.89% |
| Maj |
 |
1,994 |
3.79% |
| Turn |
 |
52,667 |
72.80% |
|
|
 |
|
Conservative
|
| Con |
 |
30,548 |
53.00% |
| Lab |
 |
2,697 |
4.70% |
| LD |
 |
23,739 |
41.20% |
| Oth |
 |
643 |
1.10% |
| Maj |
 |
6,809 |
11.80% |
| Turn |
 |
57,627 |
81.62% |
|
|
 |
|

|

