|
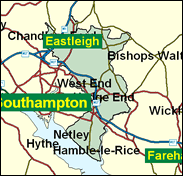
Eastleigh
Liberal Democrat hold

By-elections often cause ripples which distort the results of constituency elections in several subsequent general elections. It was no particular surprise that David Chidgey won Eastleigh in Hampshire for the Liberal Democrats in 1994 following the death of Stephen Milligan: the Lib Dems, like their predecessors, are formidable and successful byelection campaigners, especially in Tory held seats. In 1997, again as might be predicted, Chidgey held on, but with a reduced majority. However, an extra element of interest is added by the presence of Labour as serious contenders, in a seat they have not won since its creation in 1955, but where they have come close several times, most noatbly in 1966 (701 votes). Eastleigh is now a three-way marginal, and, perhaps oddly, this may help the Conservatives to recover from the byelection, from which they were still reeling in 1997, because Labour's vote is so large that it may well actually resist a tactical squeeze.

Stocky and affable, David Chidgey won here at a by-election in 1994 and unexpectedly held on in 1997. A professional engineer, originally with the Admiralty, then for 20 years in a commercial practice, he was born in 1942 and educated at Brune Hill County High School, the Royal Naval College, Portsmouth and Portsmouth Polytechnic. As a transport spokesman he was able to articulate his commuter constituents' angst over rail travel, but intensive ward-heeling is needed for him to win a third time. The Tory fight-back here is led by one of their youngest candidates, Conor Burns, Belfast-born in 1972, and educated at St. Columba's College, St. Albans, and Southampton University. An activist in the Southampton area, he claims to have helped see-off the Lib Dem challenge in Mid Dorset and North Poole in 1997. As a Catholic Ulsterman, his main interest is Northern Ireland, but he also backs the current Conservative orthodoxy of more choice (ie. private provision) in health and education.
 |
| Wealthy Achievers, Suburban Areas |
15.43% |
14.99% |
102.94 |
|
| Affluent Greys, Rural Communities |
0.00% |
2.13% |
0.00 |
|
| Prosperous Pensioners, Retirement Areas |
0.42% |
2.49% |
16.76 |
|
| Affluent Executives, Family Areas |
22.91% |
4.43% |
517.62 |
|
| Well-Off Workers, Family Areas |
18.19% |
7.27% |
250.07 |
|
| Affluent Urbanites, Town & City Areas |
1.48% |
2.56% |
57.63 |
|
| Prosperous Professionals, Metropolitan Areas |
0.00% |
2.04% |
0.00 |
|
| Better-Off Executives, Inner City Areas |
0.00% |
3.94% |
0.00 |
|
| Comfortable Middle Agers, Mature Home Owning Areas |
16.56% |
13.04% |
126.98 |
|
| Skilled Workers, Home Owning Areas |
8.56% |
12.70% |
67.40 |
|
| New Home Owners, Mature Communities |
9.64% |
8.14% |
118.35 |
|
| White Collar Workers, Better-Off Multi Ethnic Areas |
0.04% |
4.02% |
1.06 |
|
| Older People, Less Prosperous Areas |
2.35% |
3.19% |
73.71 |
|
| Council Estate Residents, Better-Off Homes |
3.59% |
11.31% |
31.74 |
|
| Council Estate Residents, High Unemployment |
0.50% |
3.06% |
16.37 |
|
| Council Estate Residents, Greatest Hardship |
0.26% |
2.52% |
10.52 |
|
| People in Multi-Ethnic, Low-Income Areas |
0.00% |
2.10% |
0.00 |
|
| Unclassified |
0.07% |
0.06% |
117.64 |
|
|
 |
 |
 |
| £0-5K |
6.90% |
9.41% |
73.27 |
|
| £5-10K |
14.23% |
16.63% |
85.56 |
|
| £10-15K |
15.97% |
16.58% |
96.33 |
|
| £15-20K |
14.15% |
13.58% |
104.18 |
|
| £20-25K |
11.37% |
10.39% |
109.38 |
|
| £25-30K |
8.75% |
7.77% |
112.54 |
|
| £30-35K |
6.62% |
5.79% |
114.23 |
|
| £35-40K |
4.98% |
4.33% |
114.90 |
|
| £40-45K |
3.75% |
3.27% |
114.86 |
|
| £45-50K |
2.84% |
2.48% |
114.35 |
|
| £50-55K |
2.16% |
1.90% |
113.53 |
|
| £55-60K |
1.66% |
1.47% |
112.52 |
|
| £60-65K |
1.28% |
1.15% |
111.38 |
|
| £65-70K |
1.00% |
0.91% |
110.17 |
|
| £70-75K |
0.78% |
0.72% |
108.93 |
|
| £75-80K |
0.62% |
0.57% |
107.68 |
|
| £80-85K |
0.49% |
0.46% |
106.45 |
|
| £85-90K |
0.39% |
0.37% |
105.24 |
|
| £90-95K |
0.32% |
0.31% |
104.06 |
|
| £95-100K |
0.26% |
0.25% |
102.91 |
|
| £100K + |
1.29% |
1.34% |
96.32 |
|
|
|

|


|
1992-1997
|
1997-2001
|
|
|
|
| Con |
-17.20% |
| Lab |
7.32% |
| LD |
5.35% |
|
| Con |
0.57% |
| Lab |
-4.90% |
| LD |
5.64% |
|
|
 |
David Chidgey
Liberal Democrat hold
|
| Con |
 |
16,302 |
34.27% |
| Lab |
 |
10,426 |
21.92% |
| LD |
 |
19,360 |
40.70% |
| Oth |
 |
1,485 |
3.12% |
| Maj |
 |
3,058 |
6.43% |
| Turn |
 |
47,573 |
63.77% |
|
|
 |
David Chidgey
Liberal Democrat hold
|
| C |
Conor Burns |
16,302 |
34.27% |
| UK |
Stephen Challis |
849 |
1.78% |
| LD |
David Chidgey |
19,360 |
40.70% |
| L |
Sam Jaffa |
10,426 |
21.92% |
| G |
Martha Lyn |
636 |
1.34% |
|
Candidates representing 5 parties stood for election to this seat.
|
|
 |
David Chidgey
Liberal Democrat gain
|
| Con |
 |
18,699 |
33.70% |
| Lab |
 |
14,883 |
26.82% |
| LD |
 |
19,453 |
35.05% |
| Ref |
 |
2,013 |
3.63% |
| Oth |
 |
446 |
0.80% |
| Maj |
 |
754 |
1.36% |
| Turn |
 |
55,494 |
76.91% |
|
|
 |
|
Conservative
|
| Con |
 |
28,620 |
50.90% |
| Lab |
 |
10,947 |
19.50% |
| LD |
 |
16,708 |
29.70% |
| Oth |
|
0 |
0.00% |
| Maj |
 |
11,912 |
21.20% |
| Turn |
 |
56,275 |
83.30% |
|
|
 |
|

|

