|
Eastwood
Labour hold

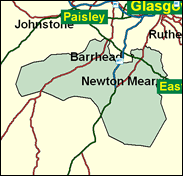
Eastwood, according to the socio-economic indicators, should be the most likely Conservative gain from Labour in Scotland next time, just as it was the most unlikely loss in the 1997 General Election. This slice of Glasgow suburbia is extremely middle class and very affluent by regional standards, and has an utterly solid Tory history, including in its previous guise as East Renfrewshire. Yet Labour's candidate won again in the 1999 Scottish parliament contests, by over 2,000, at a time when the more mixed Ayr was nearly "regained" by the former MP Phil Gallie - and Ayr has subsequently returned the only Conservative first past the post MSP in a by-election. Against the rules of history and sociology, Eastwood no longer looks like a certain or even likely Conservative win at the next General Election.

Jim Murphy, tall, beaky, thin-faced, born 1967, educated at secondary schools in Glasgow and Cape Town, and at Strathclyde University, is a former National Union of Students president. He won here in 1997. Guardian-described as "so on-message that the message occasionally has to be surgically removed from his backside," he is a Blairite fixer who helped pull the Scottish Labour Party to the centre, but redeems himself with Old Labour by his skill as a Commons footballer. His Tory opponent is former Aberdeen South MP Roland Robertson, one of three former Scots Tory MPs hoping to return to the Commons after their defeat in 1997. Born 1947, he trained as a teacher at Jordanhill College, but worked mostly as a Conservative Party organiser until election as an MP in 1992, when he revealed orthodox Thatcherite positions on most questions, though voting for lowering the homosexual age of consent in 1994.
 |
| Wealthy Achievers, Suburban Areas |
27.65% |
14.99% |
184.40 |
|
| Affluent Greys, Rural Communities |
0.00% |
2.13% |
0.00 |
|
| Prosperous Pensioners, Retirement Areas |
3.81% |
2.49% |
153.35 |
|
| Affluent Executives, Family Areas |
9.19% |
4.43% |
207.57 |
|
| Well-Off Workers, Family Areas |
14.31% |
7.27% |
196.73 |
|
| Affluent Urbanites, Town & City Areas |
3.01% |
2.56% |
117.52 |
|
| Prosperous Professionals, Metropolitan Areas |
3.04% |
2.04% |
148.75 |
|
| Better-Off Executives, Inner City Areas |
0.74% |
3.94% |
18.81 |
|
| Comfortable Middle Agers, Mature Home Owning Areas |
7.42% |
13.04% |
56.94 |
|
| Skilled Workers, Home Owning Areas |
7.41% |
12.70% |
58.35 |
|
| New Home Owners, Mature Communities |
4.25% |
8.14% |
52.18 |
|
| White Collar Workers, Better-Off Multi Ethnic Areas |
1.27% |
4.02% |
31.70 |
|
| Older People, Less Prosperous Areas |
2.42% |
3.19% |
76.00 |
|
| Council Estate Residents, Better-Off Homes |
6.55% |
11.31% |
57.88 |
|
| Council Estate Residents, High Unemployment |
5.19% |
3.06% |
169.40 |
|
| Council Estate Residents, Greatest Hardship |
3.53% |
2.52% |
140.22 |
|
| People in Multi-Ethnic, Low-Income Areas |
0.05% |
2.10% |
2.27 |
|
| Unclassified |
0.16% |
0.06% |
254.74 |
|
|
 |
 |
 |
| £0-5K |
6.25% |
9.41% |
66.35 |
|
| £5-10K |
11.33% |
16.63% |
68.11 |
|
| £10-15K |
12.83% |
16.58% |
77.42 |
|
| £15-20K |
12.17% |
13.58% |
89.63 |
|
| £20-25K |
10.66% |
10.39% |
102.55 |
|
| £25-30K |
8.94% |
7.77% |
115.03 |
|
| £30-35K |
7.33% |
5.79% |
126.48 |
|
| £35-40K |
5.92% |
4.33% |
136.61 |
|
| £40-45K |
4.75% |
3.27% |
145.36 |
|
| £45-50K |
3.79% |
2.48% |
152.75 |
|
| £50-55K |
3.03% |
1.90% |
158.86 |
|
| £55-60K |
2.42% |
1.47% |
163.80 |
|
| £60-65K |
1.93% |
1.15% |
167.70 |
|
| £65-70K |
1.55% |
0.91% |
170.68 |
|
| £70-75K |
1.24% |
0.72% |
172.85 |
|
| £75-80K |
1.00% |
0.57% |
174.31 |
|
| £80-85K |
0.81% |
0.46% |
175.15 |
|
| £85-90K |
0.66% |
0.37% |
175.46 |
|
| £90-95K |
0.53% |
0.31% |
175.32 |
|
| £95-100K |
0.44% |
0.25% |
174.79 |
|
| £100K + |
2.18% |
1.34% |
162.14 |
|
|
|

|


|
1992-1997
|
1997-2001
|
|
|
|
| Con |
-13.04% |
| Lab |
15.65% |
| LD |
-4.70% |
| SNP |
0.57% |
|
| Con |
-4.83% |
| Lab |
7.87% |
| LD |
1.20% |
| SNP |
-4.51% |
|
|
 |
Jim Murphy
Labour hold
|
| Con |
 |
13,895 |
28.73% |
| Lab |
 |
23,036 |
47.63% |
| LD |
 |
6,239 |
12.90% |
| SNP |
 |
4,137 |
8.55% |
| Oth |
 |
1,061 |
2.19% |
| Maj |
 |
9,141 |
18.90% |
| Turn |
 |
48,368 |
70.74% |
|
|
 |
Jim Murphy
Labour hold
|
| SNP |
Stewart Maxwell |
4,137 |
8.55% |
| L |
Jim Murphy |
23,036 |
47.63% |
| SSP |
Peter Murray |
814 |
1.68% |
| C |
Raymond Robertson |
13,895 |
28.73% |
| LD |
Allan Steele |
6,239 |
12.90% |
| I |
Manar Tayan |
247 |
0.51% |
|
Candidates representing 6 parties stood for election to this seat.
|
|
 |
Jim Murphy
Labour gain
|
| Con |
 |
17,530 |
33.56% |
| Lab |
 |
20,766 |
39.75% |
| LD |
 |
6,110 |
11.70% |
| SNP |
 |
6,826 |
13.07% |
| Ref |
 |
497 |
0.95% |
| Oth |
 |
506 |
0.97% |
| Maj |
 |
3,236 |
6.20% |
| Turn |
 |
52,235 |
78.32% |
|
|
 |
|
Conservative
|
| Con |
 |
24,544 |
46.60% |
| Lab |
 |
12,706 |
24.10% |
| LD |
 |
8,651 |
16.40% |
| SNP |
 |
6,589 |
12.50% |
| Oth |
 |
146 |
0.30% |
| Maj |
 |
11,838 |
22.50% |
| Turn |
 |
52,636 |
79.94% |
|
|
 |
|

|

