|
Eccles
Labour hold

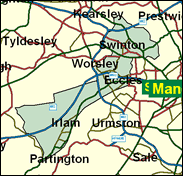
The central of the three parliamenmatry constituencies in the Greater Manchester borough of Salford, Eccles is safely Labour. There are small Tory enclaves at Ellesmere Park within Eccles ward, and Swinton South, one of two wards won by that party in the May 2000 Salford council elections (along with Worsley / Boothstown in the western Worsley constituency), but these scarcely make ripples on the millpond-smooth water of the Labour majority here, which reached nigh on 22,000 in 1997. The seat lies along the Manchester Ship Canal, a tribute to Manchester's commercial and industrial history and predominance. The Tories are going nowhere, though, in Eccles.

Ian Stewart, Labour's new MP here in 1997, is a balding, bearded Scotsman, born in 1950 and educated at secondary schools in Blantyre and in the Manchester area, and at Bolton Art College, Stretford Technical College, and Manchester Metropolitan University. Originally an electrician and Shell chemical plant worker, he was for nearly 20 years a TGWU official. He has been mildly rebellious against the Blair government, opposing lone parent benefit cuts and abolition of student maintenance grants, and calling for earnings-related pensions. Otherwise he is a staunch North Western regionalist, a pro European and an IT enthusiast.
 |
| Wealthy Achievers, Suburban Areas |
3.94% |
14.99% |
26.28 |
|
| Affluent Greys, Rural Communities |
0.08% |
2.13% |
3.63 |
|
| Prosperous Pensioners, Retirement Areas |
0.00% |
2.49% |
0.00 |
|
| Affluent Executives, Family Areas |
0.66% |
4.43% |
14.84 |
|
| Well-Off Workers, Family Areas |
3.95% |
7.27% |
54.31 |
|
| Affluent Urbanites, Town & City Areas |
0.28% |
2.56% |
10.82 |
|
| Prosperous Professionals, Metropolitan Areas |
0.00% |
2.04% |
0.00 |
|
| Better-Off Executives, Inner City Areas |
1.73% |
3.94% |
43.77 |
|
| Comfortable Middle Agers, Mature Home Owning Areas |
16.76% |
13.04% |
128.50 |
|
| Skilled Workers, Home Owning Areas |
22.01% |
12.70% |
173.24 |
|
| New Home Owners, Mature Communities |
15.83% |
8.14% |
194.37 |
|
| White Collar Workers, Better-Off Multi Ethnic Areas |
0.82% |
4.02% |
20.49 |
|
| Older People, Less Prosperous Areas |
7.25% |
3.19% |
227.60 |
|
| Council Estate Residents, Better-Off Homes |
18.70% |
11.31% |
165.32 |
|
| Council Estate Residents, High Unemployment |
2.56% |
3.06% |
83.53 |
|
| Council Estate Residents, Greatest Hardship |
5.39% |
2.52% |
213.96 |
|
| People in Multi-Ethnic, Low-Income Areas |
0.00% |
2.10% |
0.00 |
|
| Unclassified |
0.06% |
0.06% |
102.48 |
|
|
 |
 |
 |
| £0-5K |
10.35% |
9.41% |
109.98 |
|
| £5-10K |
19.24% |
16.63% |
115.69 |
|
| £10-15K |
18.72% |
16.58% |
112.93 |
|
| £15-20K |
14.64% |
13.58% |
107.76 |
|
| £20-25K |
10.59% |
10.39% |
101.85 |
|
| £25-30K |
7.45% |
7.77% |
95.86 |
|
| £30-35K |
5.22% |
5.79% |
90.10 |
|
| £35-40K |
3.67% |
4.33% |
84.70 |
|
| £40-45K |
2.60% |
3.27% |
79.72 |
|
| £45-50K |
1.87% |
2.48% |
75.16 |
|
| £50-55K |
1.35% |
1.90% |
71.01 |
|
| £55-60K |
0.99% |
1.47% |
67.23 |
|
| £60-65K |
0.73% |
1.15% |
63.80 |
|
| £65-70K |
0.55% |
0.91% |
60.68 |
|
| £70-75K |
0.42% |
0.72% |
57.85 |
|
| £75-80K |
0.32% |
0.57% |
55.26 |
|
| £80-85K |
0.24% |
0.46% |
52.90 |
|
| £85-90K |
0.19% |
0.37% |
50.74 |
|
| £90-95K |
0.15% |
0.31% |
48.75 |
|
| £95-100K |
0.12% |
0.25% |
46.93 |
|
| £100K + |
0.52% |
1.34% |
38.59 |
|
|
|

|


|
1992-1997
|
1997-2001
|
|
|
|
| Con |
-12.38% |
| Lab |
9.08% |
| LD |
1.14% |
|
| Con |
1.98% |
| Lab |
-2.21% |
| LD |
4.09% |
|
|
 |
Ian Stewart
Labour hold
|
| Con |
 |
6,867 |
20.69% |
| Lab |
 |
21,395 |
64.48% |
| LD |
 |
4,920 |
14.83% |
| Oth |
|
0 |
0.00% |
| Maj |
 |
14,528 |
43.78% |
| Turn |
 |
33,182 |
48.25% |
|
|
 |
Ian Stewart
Labour hold
|
| LD |
Bob Boyd |
4,920 |
14.83% |
| C |
Peter Caillard |
6,867 |
20.69% |
| L |
Ian Stewart |
21,395 |
64.48% |
|
Candidates representing 3 parties stood for election to this seat.
|
|
 |
Ian Stewart
Labour
|
| Con |
 |
8,552 |
18.72% |
| Lab |
 |
30,468 |
66.68% |
| LD |
 |
4,905 |
10.74% |
| Ref |
 |
1,765 |
3.86% |
| Oth |
|
0 |
0.00% |
| Maj |
 |
21,916 |
47.97% |
| Turn |
 |
45,690 |
65.60% |
|
|
 |
|
Labour
|
| Con |
 |
16,730 |
31.10% |
| Lab |
 |
30,960 |
57.60% |
| LD |
 |
5,186 |
9.60% |
| Oth |
 |
867 |
1.60% |
| Maj |
 |
14,230 |
26.50% |
| Turn |
 |
53,743 |
74.39% |
|
|
 |
|

|

