|
Eddisbury
Conservative hold

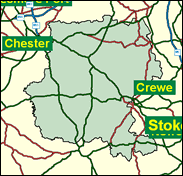
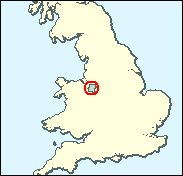
For eight years from 1989 to 1997 the Conservatives could not win a single by-election anywhere in Britain, under any circumstances, but while their fortunes have scarcely been repaired in Opposition, they have at least managed some "holds" in this Parliament. One of the most creditable was at Eddisbury in south western Cheshire, where a slender majority of 1,185 did not perish despite the migration of Sir Alasdair Goodlad to Brussels as an EU Commissioner (such causes usually militate against a defending party's chances in a by-election), and Stephen O'Brien should now be set to continue his career in the Commons for the foreseeable future. There is a substantial Labour vote based on the gritty overspill and industrial town of Winsford, whose economy was originally based on the extraction of salt and sand: there is even a ward called Gravel. But the by-election showed that this was not quite enough to overcome the more widely spread Conservative sources of support: Frodsham, Helsby, Hartford, Tarportley, Tarvin, Malpas and Audlem.

Mild-mannered former solicitor Stephen O'Brien won the Eddisbury by-election in 1999, fought by Labour on the hunting issue. Tanzania-born in 1957, he attended Loretto School, Kenya, Sedbergh School, Emmanuel College, Cambridge, and Chester College of Law. An opponent of red tape choking business, his by-election victory on countryside issues killed Labour's hopes of being the first government for 17 years to take a seat from the opposition at a by-election. Labour's Bill Sykes, born 1968, works as a press officer with the Co-operative Bank.
 |
| Wealthy Achievers, Suburban Areas |
40.32% |
14.99% |
268.94 |
|
| Affluent Greys, Rural Communities |
6.73% |
2.13% |
316.40 |
|
| Prosperous Pensioners, Retirement Areas |
0.59% |
2.49% |
23.54 |
|
| Affluent Executives, Family Areas |
9.50% |
4.43% |
214.71 |
|
| Well-Off Workers, Family Areas |
6.41% |
7.27% |
88.08 |
|
| Affluent Urbanites, Town & City Areas |
0.00% |
2.56% |
0.09 |
|
| Prosperous Professionals, Metropolitan Areas |
0.00% |
2.04% |
0.00 |
|
| Better-Off Executives, Inner City Areas |
0.00% |
3.94% |
0.00 |
|
| Comfortable Middle Agers, Mature Home Owning Areas |
12.34% |
13.04% |
94.65 |
|
| Skilled Workers, Home Owning Areas |
7.31% |
12.70% |
57.54 |
|
| New Home Owners, Mature Communities |
7.08% |
8.14% |
86.93 |
|
| White Collar Workers, Better-Off Multi Ethnic Areas |
0.07% |
4.02% |
1.81 |
|
| Older People, Less Prosperous Areas |
0.67% |
3.19% |
21.18 |
|
| Council Estate Residents, Better-Off Homes |
4.57% |
11.31% |
40.39 |
|
| Council Estate Residents, High Unemployment |
0.03% |
3.06% |
1.05 |
|
| Council Estate Residents, Greatest Hardship |
4.38% |
2.52% |
173.74 |
|
| People in Multi-Ethnic, Low-Income Areas |
0.00% |
2.10% |
0.00 |
|
| Unclassified |
0.00% |
0.06% |
0.00 |
|
|
 |
|
|
| £0-5K |
6.57% |
9.41% |
69.78 |
|
| £5-10K |
13.21% |
16.63% |
79.40 |
|
| £10-15K |
14.59% |
16.58% |
87.98 |
|
| £15-20K |
13.06% |
13.58% |
96.17 |
|
| £20-25K |
10.78% |
10.39% |
103.74 |
|
| £25-30K |
8.59% |
7.77% |
110.53 |
|
| £30-35K |
6.75% |
5.79% |
116.49 |
|
| £35-40K |
5.27% |
4.33% |
121.68 |
|
| £40-45K |
4.12% |
3.27% |
126.15 |
|
| £45-50K |
3.23% |
2.48% |
130.01 |
|
| £50-55K |
2.54% |
1.90% |
133.34 |
|
| £55-60K |
2.01% |
1.47% |
136.22 |
|
| £60-65K |
1.60% |
1.15% |
138.71 |
|
| £65-70K |
1.28% |
0.91% |
140.87 |
|
| £70-75K |
1.03% |
0.72% |
142.76 |
|
| £75-80K |
0.83% |
0.57% |
144.41 |
|
| £80-85K |
0.67% |
0.46% |
145.86 |
|
| £85-90K |
0.55% |
0.37% |
147.13 |
|
| £90-95K |
0.45% |
0.31% |
148.26 |
|
| £95-100K |
0.37% |
0.25% |
149.26 |
|
| £100K + |
2.06% |
1.34% |
153.07 |
|
|
|
|


|
1992-1997
|
1997-2001
|
|
|
|
| Con |
-10.18% |
| Lab |
9.03% |
| LD |
-1.67% |
|
| Con |
3.79% |
| Lab |
-4.11% |
| LD |
2.49% |
|
|
|
Stephen O'Brien
Conservative hold
|
| Con |
 |
20,556 |
46.31% |
| Lab |
 |
15,988 |
36.02% |
| LD |
 |
6,975 |
15.71% |
| Oth |
 |
868 |
1.96% |
| Maj |
 |
4,568 |
10.29% |
| Turn |
|
44,387 |
64.16% |
|
|
|
Stephen O'Brien
Conservative hold
|
| UK |
David Carson |
868 |
1.96% |
| L |
Bill Eyres |
15,988 |
36.02% |
| C |
Stephen O'Brien |
20,556 |
46.31% |
| LD |
Paul Roberts |
6,975 |
15.71% |
|
Candidates representing 4 parties stood for election to this seat.
|
|
|
|
By Election (22 July 1999)
|
|
Resignation of Rt Hon Sir Alastair Robertson Goodlad on appointment as High Commissioner to the Commonwealth of Australia 28 June 1999
|
Stephen O'Brien
Conservative
|
| Con |
|
15,465 |
44.84% |
| Lab |
|
13,859 |
40.18% |
| LD |
|
4,757 |
13.79% |
| Oth |
|
408 |
1.18% |
| Maj |
|
1,606 |
4.66% |
| Turn |
|
34,489 |
51.41% |
|
|
|
Alistair Goodlad
Conservative
|
| Con |
|
21,027 |
42.52% |
| Lab |
|
19,842 |
40.13% |
| LD |
|
6,540 |
13.23% |
| Ref |
 |
2,041 |
4.13% |
| Oth |
|
0 |
0.00% |
| Maj |
|
1,185 |
2.40% |
| Turn |
|
49,450 |
75.78% |
|
|
|
|
Conservative
|
| Con |
|
26,794 |
52.70% |
| Lab |
|
15,798 |
31.10% |
| LD |
|
7,553 |
14.90% |
| Oth |
|
699 |
1.40% |
| Maj |
|
10,996 |
21.60% |
| Turn |
|
50,844 |
81.54% |
|
|
|
|
|