|
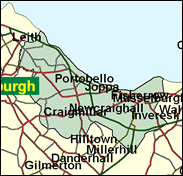
Edinburgh East & Musselburgh
Labour hold

The bright and fast-rising member of the Scottish executive Susan Deacon represents her home area as an MSP, winning with ease here in Edinburgh's east end in 1999, completing a convincing double for the Labour party after Gavin Strang's victory in the 1997 general election. Dr Strang may be approaching the end of his political career, as he has been an MP for Edinburgh East for over 30 years, and has completed his one year spell in the Cabinet (1997-98).

Gavin Strang, one of Blair's sacked Cabinet ministers, originally included in government only because of his elected place on the Shadow Cabinet, spent one year as Transport Secretary after years typecast as an Opposition Agriculture spokesman, being one of a handful of Labour MPs from a farming background. With an over-earnest, rather untelegenic manner and throaty vowels, he was born in 1943 and educated at Morrison's Academy, Crieff, and Edinburgh University. He worked briefly as an agricultural research scientist before becoming MP here aged 27 in 1970. A former Falklands War and Gulf War rebel, since his sacking he has led the revolt against air traffic control part-privatisation.
 |
| Wealthy Achievers, Suburban Areas |
5.39% |
14.99% |
35.95 |
|
| Affluent Greys, Rural Communities |
0.08% |
2.13% |
3.82 |
|
| Prosperous Pensioners, Retirement Areas |
1.55% |
2.49% |
62.34 |
|
| Affluent Executives, Family Areas |
3.28% |
4.43% |
74.16 |
|
| Well-Off Workers, Family Areas |
5.54% |
7.27% |
76.15 |
|
| Affluent Urbanites, Town & City Areas |
8.64% |
2.56% |
336.94 |
|
| Prosperous Professionals, Metropolitan Areas |
1.29% |
2.04% |
63.16 |
|
| Better-Off Executives, Inner City Areas |
11.55% |
3.94% |
292.82 |
|
| Comfortable Middle Agers, Mature Home Owning Areas |
9.38% |
13.04% |
71.93 |
|
| Skilled Workers, Home Owning Areas |
11.38% |
12.70% |
89.56 |
|
| New Home Owners, Mature Communities |
2.31% |
8.14% |
28.33 |
|
| White Collar Workers, Better-Off Multi Ethnic Areas |
2.17% |
4.02% |
53.98 |
|
| Older People, Less Prosperous Areas |
5.77% |
3.19% |
181.20 |
|
| Council Estate Residents, Better-Off Homes |
8.28% |
11.31% |
73.17 |
|
| Council Estate Residents, High Unemployment |
17.97% |
3.06% |
586.71 |
|
| Council Estate Residents, Greatest Hardship |
5.25% |
2.52% |
208.64 |
|
| People in Multi-Ethnic, Low-Income Areas |
0.00% |
2.10% |
0.00 |
|
| Unclassified |
0.18% |
0.06% |
285.79 |
|
|
 |
 |
 |
| £0-5K |
9.65% |
9.41% |
102.46 |
|
| £5-10K |
17.07% |
16.63% |
102.63 |
|
| £10-15K |
17.31% |
16.58% |
104.39 |
|
| £15-20K |
14.31% |
13.58% |
105.33 |
|
| £20-25K |
10.90% |
10.39% |
104.89 |
|
| £25-30K |
8.03% |
7.77% |
103.26 |
|
| £30-35K |
5.84% |
5.79% |
100.78 |
|
| £35-40K |
4.24% |
4.33% |
97.78 |
|
| £40-45K |
3.09% |
3.27% |
94.50 |
|
| £45-50K |
2.26% |
2.48% |
91.13 |
|
| £50-55K |
1.67% |
1.90% |
87.77 |
|
| £55-60K |
1.25% |
1.47% |
84.50 |
|
| £60-65K |
0.94% |
1.15% |
81.36 |
|
| £65-70K |
0.71% |
0.91% |
78.38 |
|
| £70-75K |
0.54% |
0.72% |
75.56 |
|
| £75-80K |
0.42% |
0.57% |
72.91 |
|
| £80-85K |
0.33% |
0.46% |
70.41 |
|
| £85-90K |
0.25% |
0.37% |
68.07 |
|
| £90-95K |
0.20% |
0.31% |
65.88 |
|
| £95-100K |
0.16% |
0.25% |
63.82 |
|
| £100K + |
0.72% |
1.34% |
53.57 |
|
|
|

|


|
1992-1997
|
1997-2001
|
|
|
|
| Con |
-8.61% |
| Lab |
8.87% |
| LD |
-0.79% |
| SNP |
1.17% |
|
| Con |
-4.06% |
| Lab |
-0.97% |
| LD |
3.75% |
| SNP |
-1.79% |
|
|
 |
Gavin Strang
Labour hold
|
| Con |
 |
3,906 |
11.34% |
| Lab |
 |
18,124 |
52.60% |
| LD |
 |
4,981 |
14.46% |
| SNP |
 |
5,956 |
17.29% |
| Oth |
 |
1,487 |
4.32% |
| Maj |
 |
12,168 |
35.32% |
| Turn |
 |
34,454 |
100.00% |
|
|
 |
Gavin Strang
Labour hold
|
| SSP |
Derek Durkin |
1,487 |
4.32% |
| C |
Peter Finnie |
3,906 |
11.34% |
| SNP |
Rob Munn |
5,956 |
17.29% |
| LD |
Gary Peacock |
4,981 |
14.46% |
| L |
Gavin Strang |
18,124 |
52.60% |
|
Candidates representing 5 parties stood for election to this seat.
|
|
 |
Gavin Strang
Labour
|
| Con |
 |
6,483 |
15.39% |
| Lab |
 |
22,564 |
53.57% |
| LD |
 |
4,511 |
10.71% |
| SNP |
 |
8,034 |
19.07% |
| Ref |
 |
526 |
1.25% |
| Oth |
|
0 |
0.00% |
| Maj |
 |
14,530 |
34.50% |
| Turn |
 |
42,118 |
70.61% |
|
|
 |
|
Labour
|
| Con |
 |
10,568 |
24.00% |
| Lab |
 |
19,669 |
44.70% |
| LD |
 |
5,075 |
11.50% |
| SNP |
 |
7,890 |
17.90% |
| Oth |
 |
801 |
1.80% |
| Maj |
 |
9,101 |
20.70% |
| Turn |
 |
44,003 |
74.39% |
|
|
 |
|

|

