|
Edinburgh North & Leith
Labour hold

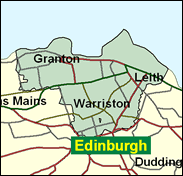
Malcolm Chisholm is one of five Scottish Labour MPs transferring full time to the Edinburgh Parliament, which will eventually be at Holyrood, leaving vacancies at Westminster, all of which are expected to be filled by - Scottish Labour MPs. North and Leith includes the elegant New Town, which still elected a Conservative to the city council in May 1999, but also some of the territory from the "other side" of Edinburgh, as starkly revealed in Irvine Welsh's Trainspotting. These include Leith itself, the tough port with only some gentrified and fashionable elements, whose abandoned station provided the key reference in Welsh's work, and Pilton the drug-ridden council estate, where the Tory received a 4pc share in the same council elections in 1999. Mark Lazarowicz will be able to take over this seat of Edinburgh contrasts with ease.

Mark Lazarowicz, born 1953, a long time Edinburgh councillor and practising advocate, is Labour's new candidate here. It has taken him years to net a safe Labour seat in Edinburgh, having been thwarted in Edinburgh Pentlands either by inadequate or adverse electoral swings - as in 1987 and 1992 - or by the fashion for female candidates, as in 1997. Or - arguably - by his name. Now he is reaching the Commons, albeit in his 48th year.
 |
| Wealthy Achievers, Suburban Areas |
1.14% |
14.99% |
7.58 |
|
| Affluent Greys, Rural Communities |
0.00% |
2.13% |
0.00 |
|
| Prosperous Pensioners, Retirement Areas |
1.65% |
2.49% |
66.28 |
|
| Affluent Executives, Family Areas |
0.64% |
4.43% |
14.40 |
|
| Well-Off Workers, Family Areas |
0.85% |
7.27% |
11.65 |
|
| Affluent Urbanites, Town & City Areas |
14.68% |
2.56% |
572.39 |
|
| Prosperous Professionals, Metropolitan Areas |
8.22% |
2.04% |
402.66 |
|
| Better-Off Executives, Inner City Areas |
39.39% |
3.94% |
998.92 |
|
| Comfortable Middle Agers, Mature Home Owning Areas |
1.16% |
13.04% |
8.92 |
|
| Skilled Workers, Home Owning Areas |
5.40% |
12.70% |
42.52 |
|
| New Home Owners, Mature Communities |
0.67% |
8.14% |
8.19 |
|
| White Collar Workers, Better-Off Multi Ethnic Areas |
3.32% |
4.02% |
82.63 |
|
| Older People, Less Prosperous Areas |
2.27% |
3.19% |
71.41 |
|
| Council Estate Residents, Better-Off Homes |
4.11% |
11.31% |
36.33 |
|
| Council Estate Residents, High Unemployment |
10.93% |
3.06% |
357.01 |
|
| Council Estate Residents, Greatest Hardship |
5.51% |
2.52% |
218.64 |
|
| People in Multi-Ethnic, Low-Income Areas |
0.06% |
2.10% |
2.92 |
|
| Unclassified |
0.00% |
0.06% |
0.00 |
|
|
 |
 |
 |
| £0-5K |
8.73% |
9.41% |
92.70 |
|
| £5-10K |
15.40% |
16.63% |
92.56 |
|
| £10-15K |
15.77% |
16.58% |
95.13 |
|
| £15-20K |
13.36% |
13.58% |
98.38 |
|
| £20-25K |
10.53% |
10.39% |
101.33 |
|
| £25-30K |
8.07% |
7.77% |
103.78 |
|
| £30-35K |
6.13% |
5.79% |
105.77 |
|
| £35-40K |
4.66% |
4.33% |
107.44 |
|
| £40-45K |
3.56% |
3.27% |
108.91 |
|
| £45-50K |
2.74% |
2.48% |
110.24 |
|
| £50-55K |
2.12% |
1.90% |
111.49 |
|
| £55-60K |
1.66% |
1.47% |
112.71 |
|
| £60-65K |
1.31% |
1.15% |
113.91 |
|
| £65-70K |
1.04% |
0.91% |
115.10 |
|
| £70-75K |
0.84% |
0.72% |
116.29 |
|
| £75-80K |
0.68% |
0.57% |
117.48 |
|
| £80-85K |
0.55% |
0.46% |
118.66 |
|
| £85-90K |
0.45% |
0.37% |
119.84 |
|
| £90-95K |
0.37% |
0.31% |
121.02 |
|
| £95-100K |
0.31% |
0.25% |
122.19 |
|
| £100K + |
1.75% |
1.34% |
129.90 |
|
|
|

|


|
1992-1997
|
1997-2001
|
|
|
|
| Con |
-6.94% |
| Lab |
12.01% |
| LD |
1.33% |
| SNP |
-0.20% |
|
| Con |
-3.94% |
| Lab |
-0.96% |
| LD |
6.39% |
| SNP |
-4.19% |
|
|
 |
Mark Lazarowicz
Labour hold
|
| Con |
 |
4,626 |
13.92% |
| Lab |
 |
15,271 |
45.95% |
| LD |
 |
6,454 |
19.42% |
| SNP |
 |
5,290 |
15.92% |
| Oth |
 |
1,593 |
4.79% |
| Maj |
 |
8,817 |
26.53% |
| Turn |
 |
33,234 |
53.20% |
|
|
 |
Mark Lazarowicz
Labour hold
|
| SSP |
Catriona Grant |
1,334 |
4.01% |
| SL |
Don Jacobsen |
259 |
0.78% |
| L |
Mark Lazarowicz |
15,271 |
45.95% |
| C |
Iain Mitchell |
4,626 |
13.92% |
| SNP |
Kaukab Stewart |
5,290 |
15.92% |
| LD |
Sebastian Tombs |
6,454 |
19.42% |
|
Candidates representing 6 parties stood for election to this seat.
|
|
 |
Malcolm Chisholm
Labour
|
| Con |
 |
7,312 |
17.86% |
| Lab |
 |
19,209 |
46.91% |
| LD |
 |
5,335 |
13.03% |
| SNP |
 |
8,231 |
20.10% |
| Ref |
 |
441 |
1.08% |
| Oth |
 |
417 |
1.02% |
| Maj |
 |
10,978 |
26.81% |
| Turn |
 |
40,945 |
66.45% |
|
|
 |
|
Labour
|
| Con |
 |
10,685 |
24.80% |
| Lab |
 |
15,019 |
34.90% |
| LD |
 |
5,038 |
11.70% |
| SNP |
 |
8,749 |
20.30% |
| Oth |
 |
3,529 |
8.20% |
| Maj |
 |
4,334 |
10.10% |
| Turn |
 |
43,020 |
71.42% |
|
|
 |
|

|

