|
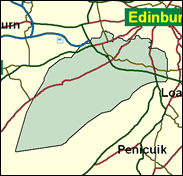
Edinburgh Pentlands
Labour hold

Clearly the Tories' best seat in the Scottish capital, and as such chosen by the party leader north of the border, David McLetchie, for his bid for direct personal election to the "Holyrood" Parliament in 1999, Pentlands still went Labour by nearly 3,000 on that occasion. Malcolm Rifkind is going to stand again, the only one of the seven cabinet ministers defeated in the 1997 massacre to be contesting the forthcoming election (Michael Portillo has returned to the Commons in a by-election; the others have gone to the Lords or given up). This is widely regarded as noble, as he could presumably have been selected if he had applied for a safe vacancy in England, but perhaps he feels he does not want to return if the party is again to be in a small minority. This is indeed the case, as Pentlands surely will not be won until the Conservatives are close to forming a government again. This, incidentally, should quash the bizarre theory aired by Philip Webster in the Times in the last days of the year 2000 that Rifkind might replace William Hague as party leader. If Rifkind gets back to the Commons, the Tories will have done so unexpectedly well that there would surely be no challenge to Hague's leadership. How could the Political Editor or others on the Thunderer have missed that simple point?

Linda Clark QC, elected here in 1997, a snub-nosed, loud-voiced Edinburgh Advocate from a working class background, was born 1949, educated at Lawside Academy, Dundee, and at St. Andrew's University, where she obtained a doctorate. In 1999 she was given the seemingly very small job of 'Advocate General for Scotland' and in her January 2001 question time answered one question, on football. Sir Malcolm Rifkind QC, whom she ousted in 1997, has stayed on in the hope of revenge. Foreign Secretary in the Major government, originally a One Nation Tory who trimmed to the right and rose through a series of Cabinet jobs, he was born in 1946, son of an emigre Lithuanian tailor, and educated at George Watson's College and Edinburgh University. Elegantly pin-striped, manic-looking and Morningside-accented, he was the first Jewish Foreign Secretary since Rufus Isaacs (Marquis of Reading) in 1932. The paradox for those who see him as a future Tory leader is that if he wins here the swing will probably have been so favourable to the Tories nationally as to secure Hague's position.
 |
| Wealthy Achievers, Suburban Areas |
24.39% |
14.99% |
162.66 |
|
| Affluent Greys, Rural Communities |
0.05% |
2.13% |
2.49 |
|
| Prosperous Pensioners, Retirement Areas |
1.21% |
2.49% |
48.76 |
|
| Affluent Executives, Family Areas |
6.03% |
4.43% |
136.36 |
|
| Well-Off Workers, Family Areas |
10.14% |
7.27% |
139.35 |
|
| Affluent Urbanites, Town & City Areas |
8.70% |
2.56% |
339.20 |
|
| Prosperous Professionals, Metropolitan Areas |
3.89% |
2.04% |
190.35 |
|
| Better-Off Executives, Inner City Areas |
2.65% |
3.94% |
67.19 |
|
| Comfortable Middle Agers, Mature Home Owning Areas |
7.29% |
13.04% |
55.91 |
|
| Skilled Workers, Home Owning Areas |
5.61% |
12.70% |
44.15 |
|
| New Home Owners, Mature Communities |
2.66% |
8.14% |
32.73 |
|
| White Collar Workers, Better-Off Multi Ethnic Areas |
0.00% |
4.02% |
0.00 |
|
| Older People, Less Prosperous Areas |
2.39% |
3.19% |
75.09 |
|
| Council Estate Residents, Better-Off Homes |
9.16% |
11.31% |
80.96 |
|
| Council Estate Residents, High Unemployment |
9.78% |
3.06% |
319.51 |
|
| Council Estate Residents, Greatest Hardship |
6.05% |
2.52% |
240.08 |
|
| People in Multi-Ethnic, Low-Income Areas |
0.00% |
2.10% |
0.00 |
|
| Unclassified |
0.00% |
0.06% |
0.00 |
|
|
 |
 |
 |
| £0-5K |
7.15% |
9.41% |
75.97 |
|
| £5-10K |
13.99% |
16.63% |
84.10 |
|
| £10-15K |
14.82% |
16.58% |
89.36 |
|
| £15-20K |
12.86% |
13.58% |
94.69 |
|
| £20-25K |
10.44% |
10.39% |
100.46 |
|
| £25-30K |
8.28% |
7.77% |
106.54 |
|
| £30-35K |
6.53% |
5.79% |
112.66 |
|
| £35-40K |
5.14% |
4.33% |
118.59 |
|
| £40-45K |
4.05% |
3.27% |
124.16 |
|
| £45-50K |
3.21% |
2.48% |
129.26 |
|
| £50-55K |
2.55% |
1.90% |
133.82 |
|
| £55-60K |
2.03% |
1.47% |
137.83 |
|
| £60-65K |
1.63% |
1.15% |
141.29 |
|
| £65-70K |
1.31% |
0.91% |
144.22 |
|
| £70-75K |
1.05% |
0.72% |
146.65 |
|
| £75-80K |
0.85% |
0.57% |
148.63 |
|
| £80-85K |
0.69% |
0.46% |
150.20 |
|
| £85-90K |
0.57% |
0.37% |
151.40 |
|
| £90-95K |
0.46% |
0.31% |
152.26 |
|
| £95-100K |
0.38% |
0.25% |
152.82 |
|
| £100K + |
2.00% |
1.34% |
148.90 |
|
|
|

|


|
1992-1997
|
1997-2001
|
|
|
|
| Con |
-7.82% |
| Lab |
11.81% |
| LD |
-2.70% |
| SNP |
-2.69% |
|
| Con |
3.72% |
| Lab |
-2.44% |
| LD |
0.81% |
| SNP |
-2.20% |
|
|
 |
Lynda Clark
Labour hold
|
| Con |
 |
14,055 |
36.10% |
| Lab |
 |
15,797 |
40.58% |
| LD |
 |
4,210 |
10.81% |
| SNP |
 |
4,210 |
10.81% |
| Oth |
 |
660 |
1.70% |
| Maj |
 |
1,742 |
4.47% |
| Turn |
 |
38,932 |
65.06% |
|
|
 |
Lynda Clark
Labour hold
|
| L |
Lynda Clark |
15,797 |
40.58% |
| SNP |
Stewart Gibb |
4,210 |
10.81% |
| UK |
William McMurdo |
105 |
0.27% |
| SSP |
James Mearns |
555 |
1.43% |
| C |
Malcolm Rifkind |
14,055 |
36.10% |
| LD |
David Walker |
4,210 |
10.81% |
|
Candidates representing 6 parties stood for election to this seat.
|
|
 |
Linda Clark
Labour gain
|
| Con |
 |
14,813 |
32.38% |
| Lab |
 |
19,675 |
43.01% |
| LD |
 |
4,575 |
10.00% |
| SNP |
 |
5,952 |
13.01% |
| Ref |
 |
422 |
0.92% |
| Oth |
 |
305 |
0.67% |
| Maj |
 |
4,862 |
10.63% |
| Turn |
 |
45,742 |
76.70% |
|
|
 |
|
Conservative
|
| Con |
 |
18,474 |
40.20% |
| Lab |
 |
14,326 |
31.20% |
| LD |
 |
5,828 |
12.70% |
| SNP |
 |
7,203 |
15.70% |
| Oth |
 |
127 |
0.30% |
| Maj |
 |
4,148 |
9.00% |
| Turn |
 |
45,958 |
77.33% |
|
|
 |
|

|

