|
Edinburgh South
Labour hold

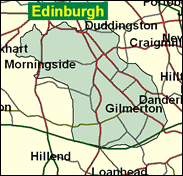
Seventy per cent middle class, nearly 50pc in professional and managerial occupations, the Edinburgh South of Merchiston and the Morningside of Miss Jean Brodie's creme de la creme in Muriel Spark's school novel was nevertheless won by Labour by nearly two to one over the Conservatives in the most recent General Election. This is partly because the old south side with its granite mansions and granite values is counterbalanced by the peripheral council estates of Liberton and Gilmerton, but it is not just that. After all, openly 20pc of the housing stock was in local authority hands in 1991. Those estates were built in the 1950s and 1960s, but South did not fall for the first time to Labour until 1987. The switch is much more to do with the long term decline of the Scottish Conservative party, which no longer seems to be owned by or even relevant to even the capital's upper middle classes. It was the Liberal Democrats who picked up most of the elite southern wards in the May 1999 city council elections; and the Tories fell to fourth in the Scottish parliament elections. Jean Brodie may have been outraged, as she was portrayed as no left winger; but in fact as one with Francoist and fascist sympathies (the book was set in the 1930s) perhaps she wouldn't have cared about the fate of mere Conservatives.

Nigel Griffiths, a short, straight-backed man with a rather robotic style of oratory, was dropped as Consumer Affairs minister from the Government in Blair's first reshuffle in 1998, despite - or rather because of - close links to Chancellor Gordon Brown, whose researcher he once was. A former welfare rights officer and as a frontbencher, campaigner on consumer issues, he was born in 1955 and educated at Hawick High School, Edinburgh University and Moray House College of Education. His election here in 1987 sent Tory MP Michael Ancram hurrying south to a safer perch at Devizes in 1992. As Consumer Affairs minister, his defence of the Murdoch press practice of predatory pricing sparked a back bench revolt.
 |
| Wealthy Achievers, Suburban Areas |
4.05% |
14.99% |
27.03 |
|
| Affluent Greys, Rural Communities |
0.00% |
2.13% |
0.00 |
|
| Prosperous Pensioners, Retirement Areas |
3.09% |
2.49% |
124.11 |
|
| Affluent Executives, Family Areas |
3.61% |
4.43% |
81.50 |
|
| Well-Off Workers, Family Areas |
3.73% |
7.27% |
51.22 |
|
| Affluent Urbanites, Town & City Areas |
15.72% |
2.56% |
613.08 |
|
| Prosperous Professionals, Metropolitan Areas |
9.72% |
2.04% |
476.45 |
|
| Better-Off Executives, Inner City Areas |
23.42% |
3.94% |
593.88 |
|
| Comfortable Middle Agers, Mature Home Owning Areas |
5.16% |
13.04% |
39.59 |
|
| Skilled Workers, Home Owning Areas |
4.36% |
12.70% |
34.33 |
|
| New Home Owners, Mature Communities |
0.96% |
8.14% |
11.78 |
|
| White Collar Workers, Better-Off Multi Ethnic Areas |
0.93% |
4.02% |
23.13 |
|
| Older People, Less Prosperous Areas |
2.93% |
3.19% |
91.97 |
|
| Council Estate Residents, Better-Off Homes |
12.03% |
11.31% |
106.40 |
|
| Council Estate Residents, High Unemployment |
6.16% |
3.06% |
201.28 |
|
| Council Estate Residents, Greatest Hardship |
2.19% |
2.52% |
86.94 |
|
| People in Multi-Ethnic, Low-Income Areas |
0.14% |
2.10% |
6.86 |
|
| Unclassified |
1.79% |
0.06% |
2,865.94 |
|
|
 |
 |
 |
| £0-5K |
8.24% |
9.41% |
87.48 |
|
| £5-10K |
14.20% |
16.63% |
85.36 |
|
| £10-15K |
14.61% |
16.58% |
88.13 |
|
| £15-20K |
12.62% |
13.58% |
92.91 |
|
| £20-25K |
10.24% |
10.39% |
98.50 |
|
| £25-30K |
8.11% |
7.77% |
104.32 |
|
| £30-35K |
6.38% |
5.79% |
110.07 |
|
| £35-40K |
5.01% |
4.33% |
115.60 |
|
| £40-45K |
3.94% |
3.27% |
120.80 |
|
| £45-50K |
3.12% |
2.48% |
125.64 |
|
| £50-55K |
2.48% |
1.90% |
130.10 |
|
| £55-60K |
1.98% |
1.47% |
134.18 |
|
| £60-65K |
1.59% |
1.15% |
137.90 |
|
| £65-70K |
1.28% |
0.91% |
141.26 |
|
| £70-75K |
1.04% |
0.72% |
144.29 |
|
| £75-80K |
0.85% |
0.57% |
147.02 |
|
| £80-85K |
0.69% |
0.46% |
149.46 |
|
| £85-90K |
0.57% |
0.37% |
151.64 |
|
| £90-95K |
0.47% |
0.31% |
153.57 |
|
| £95-100K |
0.39% |
0.25% |
155.28 |
|
| £100K + |
2.16% |
1.34% |
160.38 |
|
|
|

|


|
1992-1997
|
1997-2001
|
|
|
|
| Con |
-10.92% |
| Lab |
5.32% |
| LD |
4.44% |
| SNP |
0.02% |
|
| Con |
-4.67% |
| Lab |
-4.65% |
| LD |
9.73% |
| SNP |
-3.01% |
|
|
 |
Nigel Griffiths
Labour hold
|
| Con |
 |
6,172 |
16.61% |
| Lab |
 |
15,671 |
42.16% |
| LD |
 |
10,172 |
27.37% |
| SNP |
 |
3,683 |
9.91% |
| Oth |
 |
1,468 |
3.95% |
| Maj |
 |
5,499 |
14.80% |
| Turn |
 |
37,166 |
58.06% |
|
|
 |
Nigel Griffiths
Labour hold
|
| C |
Geoffrey Buchan |
6,172 |
16.61% |
| SSP |
Colin Fox |
933 |
2.51% |
| L |
Nigel Griffiths |
15,671 |
42.16% |
| LCA |
Margaret Hendry |
535 |
1.44% |
| LD |
Marilyne MacLaren |
10,172 |
27.37% |
| SNP |
Heather Williams |
3,683 |
9.91% |
|
Candidates representing 6 parties stood for election to this seat.
|
|
 |
Nigel Griffiths
Labour
|
| Con |
 |
9,541 |
21.28% |
| Lab |
 |
20,993 |
46.82% |
| LD |
 |
7,911 |
17.64% |
| SNP |
 |
5,791 |
12.92% |
| Ref |
 |
504 |
1.12% |
| Oth |
 |
98 |
0.22% |
| Maj |
 |
11,452 |
25.54% |
| Turn |
 |
44,838 |
71.78% |
|
|
 |
|
Labour
|
| Con |
 |
14,270 |
32.20% |
| Lab |
 |
18,426 |
41.50% |
| LD |
 |
5,855 |
13.20% |
| SNP |
 |
5,719 |
12.90% |
| Oth |
 |
108 |
0.20% |
| Maj |
 |
4,156 |
9.40% |
| Turn |
 |
44,378 |
72.00% |
|
|
 |
|

|

