|
Edinburgh West
Liberal Democrat hold

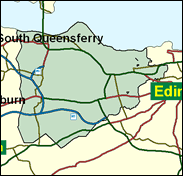
Donald Gorrie is retiring as Liberal Democrat MP for Edinburgh West at the next election, having fought the seat six times, winning only the last, but he should be able to bequeath it to his party and his successor as candidate John Barrett. That his vote was not purely a personal reward for long and diligent effort and attempt was demonstrated by the ability of the Lib Dem Margaret Smith to beat the former Conservative MP Lord James Douglas-Hamilton in the 1999 Scottish Parliament elections, by around three and a half thousand votes on a turnout which was lower than the average for Westminster contests. West is another predominantly middle class or even elite Edinburgh seat which seems to be lost to its traditional owners. There are still Conservatives on the city council in Cramond and Barnton but not in the most populous district, Corstorphine, wehere the Liberal Democrats rule locally, as they do in the parliamentary constituency.

The retreat of Donald Gorrie to the Scottish Parliament leaves Liberal Democrat hopes here in the hands of John Barrett, Gorrie's former agent, and leader of the Lib Dems on Edinburgh Council. He was born in 1954, educated at Forrester High School, Edinburgh, Telford College and Napier Polytechnic, and is a film industry buff as well as being, routinely in his party, keen on environment and conservation.
 |
| Wealthy Achievers, Suburban Areas |
21.13% |
14.99% |
140.93 |
|
| Affluent Greys, Rural Communities |
0.18% |
2.13% |
8.57 |
|
| Prosperous Pensioners, Retirement Areas |
3.06% |
2.49% |
123.22 |
|
| Affluent Executives, Family Areas |
4.31% |
4.43% |
97.32 |
|
| Well-Off Workers, Family Areas |
9.94% |
7.27% |
136.62 |
|
| Affluent Urbanites, Town & City Areas |
9.03% |
2.56% |
351.99 |
|
| Prosperous Professionals, Metropolitan Areas |
4.09% |
2.04% |
200.35 |
|
| Better-Off Executives, Inner City Areas |
2.27% |
3.94% |
57.68 |
|
| Comfortable Middle Agers, Mature Home Owning Areas |
10.26% |
13.04% |
78.71 |
|
| Skilled Workers, Home Owning Areas |
7.67% |
12.70% |
60.37 |
|
| New Home Owners, Mature Communities |
4.94% |
8.14% |
60.70 |
|
| White Collar Workers, Better-Off Multi Ethnic Areas |
0.47% |
4.02% |
11.64 |
|
| Older People, Less Prosperous Areas |
3.22% |
3.19% |
101.15 |
|
| Council Estate Residents, Better-Off Homes |
10.77% |
11.31% |
95.25 |
|
| Council Estate Residents, High Unemployment |
6.22% |
3.06% |
203.23 |
|
| Council Estate Residents, Greatest Hardship |
2.43% |
2.52% |
96.42 |
|
| People in Multi-Ethnic, Low-Income Areas |
0.00% |
2.10% |
0.00 |
|
| Unclassified |
0.00% |
0.06% |
0.00 |
|
|
 |
 |
 |
| £0-5K |
6.65% |
9.41% |
70.67 |
|
| £5-10K |
13.20% |
16.63% |
79.34 |
|
| £10-15K |
14.76% |
16.58% |
89.02 |
|
| £15-20K |
13.37% |
13.58% |
98.44 |
|
| £20-25K |
11.09% |
10.39% |
106.69 |
|
| £25-30K |
8.83% |
7.77% |
113.55 |
|
| £30-35K |
6.90% |
5.79% |
119.06 |
|
| £35-40K |
5.34% |
4.33% |
123.36 |
|
| £40-45K |
4.13% |
3.27% |
126.63 |
|
| £45-50K |
3.20% |
2.48% |
129.03 |
|
| £50-55K |
2.49% |
1.90% |
130.71 |
|
| £55-60K |
1.94% |
1.47% |
131.79 |
|
| £60-65K |
1.52% |
1.15% |
132.38 |
|
| £65-70K |
1.20% |
0.91% |
132.56 |
|
| £70-75K |
0.95% |
0.72% |
132.39 |
|
| £75-80K |
0.76% |
0.57% |
131.95 |
|
| £80-85K |
0.61% |
0.46% |
131.28 |
|
| £85-90K |
0.49% |
0.37% |
130.42 |
|
| £90-95K |
0.39% |
0.31% |
129.40 |
|
| £95-100K |
0.32% |
0.25% |
128.25 |
|
| £100K + |
1.58% |
1.34% |
117.56 |
|
|
|

|


|
1992-1997
|
1997-2001
|
|
|
|
| Con |
-10.22% |
| Lab |
1.39% |
| LD |
13.30% |
| SNP |
-3.66% |
|
| Con |
-0.08% |
| Lab |
9.84% |
| LD |
-14.57% |
| SNP |
3.85% |
|
|
 |
Elspeth Alexandra
Liberal Democrat hold
|
| Con |
 |
8,894 |
27.89% |
| Lab |
 |
9,130 |
28.63% |
| LD |
 |
9,130 |
28.63% |
| SNP |
 |
4,047 |
12.69% |
| Oth |
 |
688 |
2.16% |
| Maj |
 |
0 |
0.00% |
| Turn |
 |
31,889 |
51.52% |
|
|
 |
Elspeth Alexandra
Liberal Democrat hold
|
| L |
Elspeth Alexandra |
9,130 |
28.63% |
| LD |
John Barrett |
9,130 |
28.63% |
| SSP |
Bill Scott |
688 |
2.16% |
| SNP |
Alyn Smith |
4,047 |
12.69% |
| C |
Iain Whyte |
8,894 |
27.89% |
|
Candidates representing 5 parties stood for election to this seat.
|
|
 |
Donald Gorrie
Liberal Democrat gain
|
| Con |
 |
13,325 |
27.98% |
| Lab |
 |
8,948 |
18.79% |
| LD |
 |
20,578 |
43.20% |
| SNP |
 |
4,210 |
8.84% |
| Ref |
 |
277 |
0.58% |
| Oth |
 |
293 |
0.62% |
| Maj |
 |
7,253 |
15.23% |
| Turn |
 |
47,631 |
77.91% |
|
|
 |
|
Conservative
|
| Con |
 |
19,715 |
38.20% |
| Lab |
 |
8,961 |
17.40% |
| LD |
 |
15,424 |
29.90% |
| SNP |
 |
6,471 |
12.50% |
| Oth |
 |
1,027 |
2.00% |
| Maj |
 |
4,291 |
8.30% |
| Turn |
 |
51,598 |
83.23% |
|
|
 |
|

|

