|
Edmonton
Labour hold

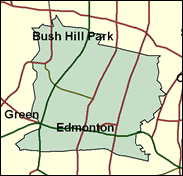
A London Evening Standard opinion poll at the beginning of December 2000 suggested that there had been no significant change in the standings of the parties since the last General Election, which is very good news for all those like Andy Love who gained seats comfortably for Labour in 1997. Edmonton is the most working class and historically Labour part of the north London borough of Enfield, situated at its eastern end along the river Lea, containing unglamorous neighbourhoods. The only ward won by the Conservatives in the 1998 Enfield borough elections was the anomalous (as its name makes clear) Village. Love won by 30pc although the seat was gained from a sitting Tory MP. Brentford and Isleworth may have been gained with a larger numerical majority, over 14,000, but nowhere was gained with a larger percentage majority. It was a case of thirty-love to Love.

Amiable, dark-moustached loyalist Andy Love, born 1949, educated at Greenock High School and Strathclyde University, is one of a score of itinerant Scots holding seats for Labour in England. Winning here in 1997, having fought and lost it in 1992, he had risen in Labour politics via the Co-operative Party and movement. With a sizeable local Greek Cypriot minority, he makes regular visits to the island and inveighs against the Turkish occupation of the North.
 |
| Wealthy Achievers, Suburban Areas |
5.78% |
14.99% |
38.53 |
|
| Affluent Greys, Rural Communities |
0.00% |
2.13% |
0.00 |
|
| Prosperous Pensioners, Retirement Areas |
1.06% |
2.49% |
42.72 |
|
| Affluent Executives, Family Areas |
0.00% |
4.43% |
0.00 |
|
| Well-Off Workers, Family Areas |
0.00% |
7.27% |
0.00 |
|
| Affluent Urbanites, Town & City Areas |
3.23% |
2.56% |
126.03 |
|
| Prosperous Professionals, Metropolitan Areas |
0.63% |
2.04% |
30.98 |
|
| Better-Off Executives, Inner City Areas |
0.50% |
3.94% |
12.68 |
|
| Comfortable Middle Agers, Mature Home Owning Areas |
6.25% |
13.04% |
47.94 |
|
| Skilled Workers, Home Owning Areas |
21.67% |
12.70% |
170.62 |
|
| New Home Owners, Mature Communities |
3.31% |
8.14% |
40.60 |
|
| White Collar Workers, Better-Off Multi Ethnic Areas |
31.44% |
4.02% |
781.85 |
|
| Older People, Less Prosperous Areas |
1.92% |
3.19% |
60.35 |
|
| Council Estate Residents, Better-Off Homes |
13.22% |
11.31% |
116.89 |
|
| Council Estate Residents, High Unemployment |
7.89% |
3.06% |
257.59 |
|
| Council Estate Residents, Greatest Hardship |
1.23% |
2.52% |
48.66 |
|
| People in Multi-Ethnic, Low-Income Areas |
1.87% |
2.10% |
88.91 |
|
| Unclassified |
0.00% |
0.06% |
0.00 |
|
|
 |
 |
 |
| £0-5K |
8.19% |
9.41% |
86.97 |
|
| £5-10K |
14.89% |
16.63% |
89.50 |
|
| £10-15K |
15.81% |
16.58% |
95.35 |
|
| £15-20K |
13.68% |
13.58% |
100.73 |
|
| £20-25K |
10.91% |
10.39% |
104.96 |
|
| £25-30K |
8.40% |
7.77% |
108.05 |
|
| £30-35K |
6.38% |
5.79% |
110.16 |
|
| £35-40K |
4.83% |
4.33% |
111.52 |
|
| £40-45K |
3.67% |
3.27% |
112.29 |
|
| £45-50K |
2.80% |
2.48% |
112.63 |
|
| £50-55K |
2.15% |
1.90% |
112.65 |
|
| £55-60K |
1.66% |
1.47% |
112.43 |
|
| £60-65K |
1.29% |
1.15% |
112.04 |
|
| £65-70K |
1.01% |
0.91% |
111.53 |
|
| £70-75K |
0.80% |
0.72% |
110.94 |
|
| £75-80K |
0.63% |
0.57% |
110.29 |
|
| £80-85K |
0.51% |
0.46% |
109.60 |
|
| £85-90K |
0.41% |
0.37% |
108.90 |
|
| £90-95K |
0.33% |
0.31% |
108.18 |
|
| £95-100K |
0.27% |
0.25% |
107.47 |
|
| £100K + |
1.38% |
1.34% |
102.94 |
|
|
|

|


|
1992-1997
|
1997-2001
|
|
|
|
| Con |
-16.06% |
| Lab |
15.28% |
| LD |
-1.95% |
|
| Con |
0.56% |
| Lab |
-1.38% |
| LD |
0.66% |
|
|
 |
Andrew Love
Labour hold
|
| Con |
 |
10,709 |
30.80% |
| Lab |
 |
20,481 |
58.90% |
| LD |
 |
2,438 |
7.01% |
| Oth |
 |
1,146 |
3.30% |
| Maj |
 |
9,772 |
28.10% |
| Turn |
 |
34,774 |
55.82% |
|
|
 |
Andrew Love
Labour hold
|
| Reform |
Erol Basarik |
344 |
0.99% |
| C |
David Burrowes |
10,709 |
30.80% |
| LC |
Andrew Love |
20,481 |
58.90% |
| SA |
Howard Medwell |
296 |
0.85% |
| UK |
Gwyneth Rolph |
406 |
1.17% |
| I |
Ram Saxena |
100 |
0.29% |
| LD |
Douglas Taylor |
2,438 |
7.01% |
|
Candidates representing 7 parties stood for election to this seat.
|
|
 |
Andy Love
Labour gain
|
| Con |
 |
13,557 |
30.24% |
| Lab |
 |
27,029 |
60.28% |
| LD |
 |
2,847 |
6.35% |
| Ref |
 |
708 |
1.58% |
| Oth |
 |
697 |
1.55% |
| Maj |
 |
13,472 |
30.05% |
| Turn |
 |
44,838 |
70.37% |
|
|
 |
|
Conservative
|
| Con |
 |
22,076 |
46.30% |
| Lab |
 |
21,483 |
45.00% |
| LD |
 |
3,940 |
8.30% |
| Oth |
 |
207 |
0.40% |
| Maj |
 |
593 |
1.20% |
| Turn |
 |
47,706 |
74.63% |
|
|
 |
|

|

