|
Ellesmere Port & Neston
Labour hold

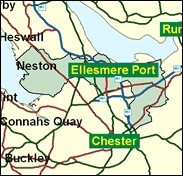
Ellesmere Port and Neston is to be found at the foot of the Wirral peninisula but still included in Cheshire rather than Merseyside. It is one of those seats which were won by the Conservatives in 1983 and 1987, but those were both occasions on which Mrs Thatcher's government was returned with a majority of over 100, which seemed almost inevitable then, but as time goes by is looking more and more like an aberration. Perhaps Labour's three figure overall majority is also aberrant, but in an even year this seat would still be in their hands, although with a majority about half its present level of 16,000. Ellesmere Port is an industrial town, known most for the Stanlow oil refinery (blockaded by fuel protestors in September 2000) and the Vauxhall car plant (not threatened with closure like the one at Luton in 2001), and has always been regarded as a Labour stronghold. Neston is a different matter, mainly middle class and sharing many of the characteristics of the traditionally Tory west and south Wirral. However both of those areas fell to Labour in 1997, and Neston itself was probably fairly close, as the county council results there on the same day as the 1997 General Election tell us: Labour beat the Tories in the Neston / Parkgate ward by a hundred votes.

Ginger-bearded, if otherwise monochrome, Andrew Miller, a former MSF trade union officer, won this seat in 1992. He established a reputation as a keen advocate of e-commerce and - in 1997 - as a defender of his constituent, the nanny Louise Woodward, accused of child-killing in the US. Born 1949, educated at Hayling Island County Secondary School and taking a one-year diploma course at LSE, he was originally a Geology laboratory assistant at Portsmouth Polytechnic. Like most IT freaks, he does not ignite the heather.
 |
| Wealthy Achievers, Suburban Areas |
17.67% |
14.99% |
117.86 |
|
| Affluent Greys, Rural Communities |
0.10% |
2.13% |
4.67 |
|
| Prosperous Pensioners, Retirement Areas |
0.13% |
2.49% |
5.41 |
|
| Affluent Executives, Family Areas |
7.35% |
4.43% |
166.12 |
|
| Well-Off Workers, Family Areas |
22.58% |
7.27% |
310.46 |
|
| Affluent Urbanites, Town & City Areas |
0.32% |
2.56% |
12.31 |
|
| Prosperous Professionals, Metropolitan Areas |
0.00% |
2.04% |
0.00 |
|
| Better-Off Executives, Inner City Areas |
0.03% |
3.94% |
0.68 |
|
| Comfortable Middle Agers, Mature Home Owning Areas |
9.33% |
13.04% |
71.56 |
|
| Skilled Workers, Home Owning Areas |
8.53% |
12.70% |
67.19 |
|
| New Home Owners, Mature Communities |
9.11% |
8.14% |
111.81 |
|
| White Collar Workers, Better-Off Multi Ethnic Areas |
0.01% |
4.02% |
0.17 |
|
| Older People, Less Prosperous Areas |
3.92% |
3.19% |
122.91 |
|
| Council Estate Residents, Better-Off Homes |
16.38% |
11.31% |
144.84 |
|
| Council Estate Residents, High Unemployment |
0.66% |
3.06% |
21.62 |
|
| Council Estate Residents, Greatest Hardship |
3.88% |
2.52% |
154.11 |
|
| People in Multi-Ethnic, Low-Income Areas |
0.00% |
2.10% |
0.00 |
|
| Unclassified |
0.00% |
0.06% |
0.00 |
|
|
 |
 |
 |
| £0-5K |
8.59% |
9.41% |
91.20 |
|
| £5-10K |
16.40% |
16.63% |
98.63 |
|
| £10-15K |
16.76% |
16.58% |
101.07 |
|
| £15-20K |
13.85% |
13.58% |
101.97 |
|
| £20-25K |
10.63% |
10.39% |
102.29 |
|
| £25-30K |
7.95% |
7.77% |
102.24 |
|
| £30-35K |
5.90% |
5.79% |
101.89 |
|
| £35-40K |
4.39% |
4.33% |
101.29 |
|
| £40-45K |
3.28% |
3.27% |
100.49 |
|
| £45-50K |
2.47% |
2.48% |
99.53 |
|
| £50-55K |
1.88% |
1.90% |
98.48 |
|
| £55-60K |
1.44% |
1.47% |
97.37 |
|
| £60-65K |
1.11% |
1.15% |
96.23 |
|
| £65-70K |
0.86% |
0.91% |
95.08 |
|
| £70-75K |
0.68% |
0.72% |
93.94 |
|
| £75-80K |
0.53% |
0.57% |
92.83 |
|
| £80-85K |
0.42% |
0.46% |
91.75 |
|
| £85-90K |
0.34% |
0.37% |
90.71 |
|
| £90-95K |
0.27% |
0.31% |
89.71 |
|
| £95-100K |
0.22% |
0.25% |
88.75 |
|
| £100K + |
1.12% |
1.34% |
83.50 |
|
|
|

|


|
1992-1997
|
1997-2001
|
|
|
|
| Con |
-13.04% |
| Lab |
11.77% |
| LD |
-0.01% |
|
| Con |
0.09% |
| Lab |
-4.27% |
| LD |
2.74% |
|
|
 |
Andrew Miller
Labour hold
|
| Con |
 |
12,103 |
29.14% |
| Lab |
 |
22,964 |
55.30% |
| LD |
 |
4,828 |
11.63% |
| Oth |
 |
1,633 |
3.93% |
| Maj |
 |
10,861 |
26.15% |
| Turn |
 |
41,528 |
60.94% |
|
|
 |
Andrew Miller
Labour hold
|
| UK |
Henry Crocker |
824 |
1.98% |
| LD |
Stuart Kelly |
4,828 |
11.63% |
| L |
Andrew Miller |
22,964 |
55.30% |
| G |
Geoff Nicholls |
809 |
1.95% |
| C |
Gareth Williams |
12,103 |
29.14% |
|
Candidates representing 5 parties stood for election to this seat.
|
|
 |
Andrew Miller
Labour
|
| Con |
 |
15,274 |
29.06% |
| Lab |
 |
31,310 |
59.57% |
| LD |
 |
4,673 |
8.89% |
| Ref |
 |
1,305 |
2.48% |
| Oth |
|
0 |
0.00% |
| Maj |
 |
16,036 |
30.51% |
| Turn |
 |
52,562 |
77.79% |
|
|
 |
|
Labour
|
| Con |
 |
23,603 |
42.10% |
| Lab |
 |
26,836 |
47.80% |
| LD |
 |
5,012 |
8.90% |
| Oth |
 |
648 |
1.20% |
| Maj |
 |
3,233 |
5.80% |
| Turn |
 |
56,099 |
83.68% |
|
|
 |
|

|

