|
Elmet
Labour hold

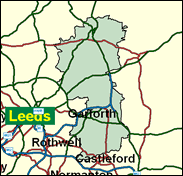
In the May 2000 local elections in Leeds Metropolitan Borough, the Conservatives outpolled Labour if the votes cast in the four wards which make up the Elmet seat are totted up. As usual, this was solely because of their large lead in just one ward, Wetherby; Labour held the other three. The turnout in Wetherby was 34pc, in the rest of the seat just under 30pc; nevertheless, this disparity may be repeated in the next General Election (although we shall never find out because the results in Britain, unlike the USA, are always declared as a whole). Elmet will again be a classic marginal of two disparate parts, vying for control over its representation east of Leeds.

Colin Burgon, a Catholic-educated (St Michael's College, Leeds) warehouseman, clerk, teacher and finally local government officer, born in 1948, won this seat at his third attempt in 1997. An opponent of local opencast mining, he has done little to trouble the scorers, tabling only 5 written questions in his first year, doubtless happy to have arrived at last and content to be lobby fodder.
 |
| Wealthy Achievers, Suburban Areas |
24.42% |
14.99% |
162.84 |
|
| Affluent Greys, Rural Communities |
0.04% |
2.13% |
1.92 |
|
| Prosperous Pensioners, Retirement Areas |
0.46% |
2.49% |
18.69 |
|
| Affluent Executives, Family Areas |
2.95% |
4.43% |
66.65 |
|
| Well-Off Workers, Family Areas |
15.54% |
7.27% |
213.59 |
|
| Affluent Urbanites, Town & City Areas |
0.81% |
2.56% |
31.78 |
|
| Prosperous Professionals, Metropolitan Areas |
0.01% |
2.04% |
0.36 |
|
| Better-Off Executives, Inner City Areas |
0.00% |
3.94% |
0.00 |
|
| Comfortable Middle Agers, Mature Home Owning Areas |
21.48% |
13.04% |
164.76 |
|
| Skilled Workers, Home Owning Areas |
6.51% |
12.70% |
51.26 |
|
| New Home Owners, Mature Communities |
13.02% |
8.14% |
159.86 |
|
| White Collar Workers, Better-Off Multi Ethnic Areas |
0.13% |
4.02% |
3.31 |
|
| Older People, Less Prosperous Areas |
2.66% |
3.19% |
83.63 |
|
| Council Estate Residents, Better-Off Homes |
10.85% |
11.31% |
95.94 |
|
| Council Estate Residents, High Unemployment |
0.96% |
3.06% |
31.41 |
|
| Council Estate Residents, Greatest Hardship |
0.13% |
2.52% |
5.16 |
|
| People in Multi-Ethnic, Low-Income Areas |
0.00% |
2.10% |
0.00 |
|
| Unclassified |
0.02% |
0.06% |
30.28 |
|
|
 |
 |
 |
| £0-5K |
7.27% |
9.41% |
77.25 |
|
| £5-10K |
14.03% |
16.63% |
84.35 |
|
| £10-15K |
15.22% |
16.58% |
91.81 |
|
| £15-20K |
13.42% |
13.58% |
98.81 |
|
| £20-25K |
10.90% |
10.39% |
104.90 |
|
| £25-30K |
8.55% |
7.77% |
109.96 |
|
| £30-35K |
6.61% |
5.79% |
114.04 |
|
| £35-40K |
5.08% |
4.33% |
117.26 |
|
| £40-45K |
3.91% |
3.27% |
119.76 |
|
| £45-50K |
3.02% |
2.48% |
121.67 |
|
| £50-55K |
2.34% |
1.90% |
123.10 |
|
| £55-60K |
1.83% |
1.47% |
124.15 |
|
| £60-65K |
1.44% |
1.15% |
124.90 |
|
| £65-70K |
1.14% |
0.91% |
125.41 |
|
| £70-75K |
0.90% |
0.72% |
125.74 |
|
| £75-80K |
0.72% |
0.57% |
125.91 |
|
| £80-85K |
0.58% |
0.46% |
125.98 |
|
| £85-90K |
0.47% |
0.37% |
125.95 |
|
| £90-95K |
0.38% |
0.31% |
125.85 |
|
| £95-100K |
0.31% |
0.25% |
125.71 |
|
| £100K + |
1.67% |
1.34% |
124.00 |
|
|
|

|


|
1992-1997
|
1997-2001
|
|
|
|
| Con |
-11.32% |
| Lab |
10.50% |
| LD |
-1.83% |
|
| Con |
2.72% |
| Lab |
-4.43% |
| LD |
2.21% |
|
|
 |
Colin Burgon
Labour hold
|
| Con |
 |
17,867 |
38.89% |
| Lab |
 |
22,038 |
47.97% |
| LD |
 |
5,001 |
10.89% |
| Oth |
 |
1,031 |
2.24% |
| Maj |
 |
4,171 |
9.08% |
| Turn |
 |
45,937 |
100.00% |
|
|
 |
Colin Burgon
Labour hold
|
| L |
Colin Burgon |
22,038 |
47.97% |
| LD |
Madeleine Kirk |
5,001 |
10.89% |
| C |
Andrew Millard |
17,867 |
38.89% |
| UK |
Andrew Spence |
1,031 |
2.24% |
|
Candidates representing 4 parties stood for election to this seat.
|
|
 |
Colin Burgon
Labour gain
|
| Con |
 |
19,569 |
36.18% |
| Lab |
 |
28,348 |
52.40% |
| LD |
 |
4,691 |
8.67% |
| Ref |
 |
1,487 |
2.75% |
| Oth |
|
0 |
0.00% |
| Maj |
 |
8,779 |
16.23% |
| Turn |
 |
54,095 |
76.81% |
|
|
 |
|
Conservative
|
| Con |
 |
27,677 |
47.50% |
| Lab |
 |
24,416 |
41.90% |
| LD |
 |
6,144 |
10.50% |
| Oth |
|
0 |
0.00% |
| Maj |
 |
3,261 |
5.60% |
| Turn |
 |
58,237 |
81.48% |
|
|
 |
|

|

