|
Eltham
Labour hold

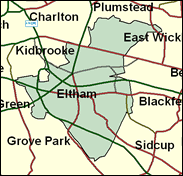
The former London taxi driver Clive Efford will be returned by Eltham for a second term if Labour win the General Election by any kind of margin overall, or even if they are the largest party. This seat in south east London was only slightly redrawn by the Boundary Commission before the 1997 General Election, but this was enough to send the MP Peter Bottomley, who had represented this area for over twenty years, haring off to safer pastures by the sea in Worthing. The Conservatives have no safe wards here in Greenwich borough elections, and although they were only 16pc behind Labour in those in 1998 there was no significant sign of a recovery to give the new candidate hope. One other note. This was the scene of the racist murder of Stephen Lawrence in 1993, which has had so many wider consequences (though this does not yet include conviction of anyone for the crime). The British National Party polled 491 votes (1.1pc) here in 1997 and finished sixth and last.

Labour's bearded Clive Elford, elected in 1997, the Commons' first black-cab driver, has naturally enough backed attempts to force licensing on rival rogue mini-cab drivers. Born 1958 and educated at Walworth Comprehensive School, he also backs energy efficiency, integrated transport and vetting of private school staff "to minimise the likelihood of further deranged individuals reaching Tory benches". In 1998 he met Eltham's most famous son, Bob Hope, in the US.
 |
| Wealthy Achievers, Suburban Areas |
9.94% |
14.99% |
66.33 |
|
| Affluent Greys, Rural Communities |
0.00% |
2.13% |
0.00 |
|
| Prosperous Pensioners, Retirement Areas |
2.56% |
2.49% |
103.15 |
|
| Affluent Executives, Family Areas |
0.00% |
4.43% |
0.00 |
|
| Well-Off Workers, Family Areas |
0.17% |
7.27% |
2.37 |
|
| Affluent Urbanites, Town & City Areas |
2.90% |
2.56% |
112.94 |
|
| Prosperous Professionals, Metropolitan Areas |
4.90% |
2.04% |
240.16 |
|
| Better-Off Executives, Inner City Areas |
1.29% |
3.94% |
32.66 |
|
| Comfortable Middle Agers, Mature Home Owning Areas |
16.90% |
13.04% |
129.58 |
|
| Skilled Workers, Home Owning Areas |
15.14% |
12.70% |
119.19 |
|
| New Home Owners, Mature Communities |
7.69% |
8.14% |
94.48 |
|
| White Collar Workers, Better-Off Multi Ethnic Areas |
9.40% |
4.02% |
233.78 |
|
| Older People, Less Prosperous Areas |
5.88% |
3.19% |
184.52 |
|
| Council Estate Residents, Better-Off Homes |
17.21% |
11.31% |
152.13 |
|
| Council Estate Residents, High Unemployment |
3.48% |
3.06% |
113.58 |
|
| Council Estate Residents, Greatest Hardship |
0.69% |
2.52% |
27.35 |
|
| People in Multi-Ethnic, Low-Income Areas |
1.46% |
2.10% |
69.65 |
|
| Unclassified |
0.39% |
0.06% |
620.56 |
|
|
 |
 |
 |
| £0-5K |
7.69% |
9.41% |
81.70 |
|
| £5-10K |
13.70% |
16.63% |
82.34 |
|
| £10-15K |
14.66% |
16.58% |
88.43 |
|
| £15-20K |
12.96% |
13.58% |
95.45 |
|
| £20-25K |
10.62% |
10.39% |
102.23 |
|
| £25-30K |
8.43% |
7.77% |
108.40 |
|
| £30-35K |
6.59% |
5.79% |
113.86 |
|
| £35-40K |
5.14% |
4.33% |
118.62 |
|
| £40-45K |
4.01% |
3.27% |
122.74 |
|
| £45-50K |
3.13% |
2.48% |
126.29 |
|
| £50-55K |
2.46% |
1.90% |
129.35 |
|
| £55-60K |
1.95% |
1.47% |
131.98 |
|
| £60-65K |
1.55% |
1.15% |
134.25 |
|
| £65-70K |
1.23% |
0.91% |
136.20 |
|
| £70-75K |
0.99% |
0.72% |
137.89 |
|
| £75-80K |
0.80% |
0.57% |
139.34 |
|
| £80-85K |
0.65% |
0.46% |
140.60 |
|
| £85-90K |
0.53% |
0.37% |
141.69 |
|
| £90-95K |
0.44% |
0.31% |
142.63 |
|
| £95-100K |
0.36% |
0.25% |
143.45 |
|
| £100K + |
1.96% |
1.34% |
146.04 |
|
|
|

|


|
1992-1997
|
1997-2001
|
|
|
|
| Con |
-12.75% |
| Lab |
14.50% |
| LD |
-6.98% |
|
| Con |
0.98% |
| Lab |
-1.76% |
| LD |
3.67% |
|
|
 |
Clive Efford
Labour hold
|
| Con |
 |
10,859 |
32.13% |
| Lab |
 |
17,855 |
52.84% |
| LD |
 |
4,121 |
12.20% |
| Oth |
 |
957 |
2.83% |
| Maj |
 |
6,996 |
20.70% |
| Turn |
 |
33,792 |
58.75% |
|
|
 |
Clive Efford
Labour hold
|
| L |
Clive Efford |
17,855 |
52.84% |
| I |
Andrew Graham |
251 |
0.74% |
| UK |
Terry Jones |
706 |
2.09% |
| C |
Sharon Massey |
10,859 |
32.13% |
| LD |
Martin Morris |
4,121 |
12.20% |
|
Candidates representing 5 parties stood for election to this seat.
|
|
 |
Clive Efford
Labour gain
|
| Con |
 |
13,528 |
31.15% |
| Lab |
 |
23,710 |
54.60% |
| LD |
 |
3,701 |
8.52% |
| Ref |
 |
1,414 |
3.26% |
| Oth |
 |
1,075 |
2.48% |
| Maj |
 |
10,182 |
23.45% |
| Turn |
 |
43,428 |
75.71% |
|
|
 |
|
Conservative
|
| Con |
 |
20,384 |
43.90% |
| Lab |
 |
18,604 |
40.10% |
| LD |
 |
7,213 |
15.50% |
| Oth |
 |
198 |
0.40% |
| Maj |
 |
1,780 |
3.80% |
| Turn |
 |
46,399 |
76.50% |
|
|
 |
|

|

