|
Enfield North
Labour hold

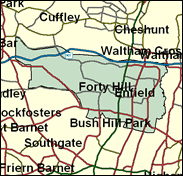
Part of a block of seats beginning with the letter E which supplied Labour with ecstasy by reporting dramatic gains from the Conservatives in the May 1997 Election, Enfield North, like most of the others, seems very likely to remain in their column for at least one more term. The Conservatives cut that lead to 4pc in 1998, winning Chase, Town and Willow wards, but lost out in the others including Ponders End, to which Norman Tebbit's father migrated on his bike, and where that noble and gentle lord grew up. In 1999 the Conservatives were actually ahead in the votes cast in this seat in the Euro-elections, but in most of their targets they did much better that year on a low turnout and Labour's weakest issue. This is the crucial swing seat in Enfield, but Labour are still favourites here at the time of writing.

Joan Ryan, PPS to Chief Secretary to the Treasury Andrew Smith, won this seat in 1997. Initially (before the election) she sounded keen on renationalising public utilities, but as a backbencher has been ultra loyal, pitching on-message locally-focused questions. A school teacher for 13 years, and a council deputy leader, she has been dubbed 'Junket Joan' for her trips to Cyprus where she backs the Greeks (a constituency interest) against the Turks. She backed the return of London government but without Livingstone as mayor. She was born 1955, attended Catholic schools and the City of Liverpool College of Higher Education, South Bank Polytechnic and Avery Hill Teacher Training College.
 |
| Wealthy Achievers, Suburban Areas |
2.47% |
14.99% |
16.47 |
|
| Affluent Greys, Rural Communities |
0.00% |
2.13% |
0.00 |
|
| Prosperous Pensioners, Retirement Areas |
1.00% |
2.49% |
40.37 |
|
| Affluent Executives, Family Areas |
0.03% |
4.43% |
0.64 |
|
| Well-Off Workers, Family Areas |
0.26% |
7.27% |
3.56 |
|
| Affluent Urbanites, Town & City Areas |
4.84% |
2.56% |
188.65 |
|
| Prosperous Professionals, Metropolitan Areas |
4.77% |
2.04% |
233.83 |
|
| Better-Off Executives, Inner City Areas |
0.28% |
3.94% |
7.15 |
|
| Comfortable Middle Agers, Mature Home Owning Areas |
11.58% |
13.04% |
88.79 |
|
| Skilled Workers, Home Owning Areas |
40.83% |
12.70% |
321.43 |
|
| New Home Owners, Mature Communities |
5.15% |
8.14% |
63.24 |
|
| White Collar Workers, Better-Off Multi Ethnic Areas |
5.86% |
4.02% |
145.81 |
|
| Older People, Less Prosperous Areas |
6.27% |
3.19% |
196.89 |
|
| Council Estate Residents, Better-Off Homes |
12.87% |
11.31% |
113.79 |
|
| Council Estate Residents, High Unemployment |
2.28% |
3.06% |
74.31 |
|
| Council Estate Residents, Greatest Hardship |
0.86% |
2.52% |
34.18 |
|
| People in Multi-Ethnic, Low-Income Areas |
0.65% |
2.10% |
30.74 |
|
| Unclassified |
0.00% |
0.06% |
0.00 |
|
|
 |
 |
 |
| £0-5K |
7.84% |
9.41% |
83.33 |
|
| £5-10K |
14.31% |
16.63% |
86.07 |
|
| £10-15K |
15.35% |
16.58% |
92.61 |
|
| £15-20K |
13.45% |
13.58% |
99.02 |
|
| £20-25K |
10.85% |
10.39% |
104.44 |
|
| £25-30K |
8.45% |
7.77% |
108.74 |
|
| £30-35K |
6.49% |
5.79% |
112.02 |
|
| £35-40K |
4.96% |
4.33% |
114.42 |
|
| £40-45K |
3.79% |
3.27% |
116.11 |
|
| £45-50K |
2.91% |
2.48% |
117.23 |
|
| £50-55K |
2.25% |
1.90% |
117.89 |
|
| £55-60K |
1.74% |
1.47% |
118.19 |
|
| £60-65K |
1.36% |
1.15% |
118.21 |
|
| £65-70K |
1.07% |
0.91% |
118.02 |
|
| £70-75K |
0.85% |
0.72% |
117.65 |
|
| £75-80K |
0.67% |
0.57% |
117.16 |
|
| £80-85K |
0.54% |
0.46% |
116.56 |
|
| £85-90K |
0.43% |
0.37% |
115.89 |
|
| £90-95K |
0.35% |
0.31% |
115.17 |
|
| £95-100K |
0.29% |
0.25% |
114.40 |
|
| £100K + |
1.46% |
1.34% |
108.62 |
|
|
|

|


|
1992-1997
|
1997-2001
|
|
|
|
| Con |
-16.55% |
| Lab |
15.76% |
| LD |
-2.15% |
|
| Con |
4.35% |
| Lab |
-3.98% |
| LD |
-0.19% |
|
|
 |
Joan Ryan
Labour hold
|
| Con |
 |
15,597 |
40.70% |
| Lab |
 |
17,888 |
46.68% |
| LD |
 |
3,355 |
8.75% |
| Oth |
 |
1,483 |
3.87% |
| Maj |
 |
2,291 |
5.98% |
| Turn |
 |
38,323 |
56.56% |
|
|
 |
Joan Ryan
Labour hold
|
| P |
Michael Akerman |
241 |
0.63% |
| I |
Richard Course |
210 |
0.55% |
| C |
Nick De Bois |
15,597 |
40.70% |
| UK |
Brian Hall |
427 |
1.11% |
| BNP |
Ramon Jones |
605 |
1.58% |
| LD |
Hilary Leighter |
3,355 |
8.75% |
| L |
Joan Ryan |
17,888 |
46.68% |
|
Candidates representing 7 parties stood for election to this seat.
|
|
 |
Joan Ryan
Labour gain
|
| Con |
 |
17,326 |
36.35% |
| Lab |
 |
24,148 |
50.66% |
| LD |
 |
4,264 |
8.95% |
| Ref |
 |
857 |
1.80% |
| Oth |
 |
1,074 |
2.25% |
| Maj |
 |
6,822 |
14.31% |
| Turn |
 |
47,669 |
70.43% |
|
|
 |
|
Conservative
|
| Con |
 |
27,789 |
52.90% |
| Lab |
 |
18,359 |
34.90% |
| LD |
 |
5,817 |
11.10% |
| Oth |
 |
565 |
1.10% |
| Maj |
 |
9,430 |
18.00% |
| Turn |
 |
52,530 |
76.58% |
|
|
 |
|

|

