|
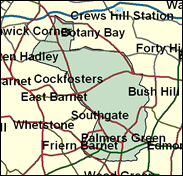
Enfield, Southgate
Labour hold

It is often assumed that Stephen Twigg's victory over Michael Portillo, for so many the highlight of election results night on 1 May 1997, was an aberration which will be reversed next time (though not by Portillo, who has moved to another London seat, Kensington and Chelsea, in a 1999 by-election). However, local results, and London-wide and even national opinion polls suggest that this is not quite so certain, as the long-term shift on the frings of the capital to new Labour has lasted beyond most expectations. John Flack must treat Southgate as no more than a 50-50 chance, and Stephen Twigg may not (yet) have to move to continue that parliamentary career which started so spectacularly.

Stephen Twigg was Labour's most emblematic winner in 1997 as the unexpected vanquisher of an unpopular Cabinet Minister, Michael Portillo, and as one of a clutch of known homosexual MPs. Born in 1966 and educated at Southgate Comprehensive and Balliol College Oxford, very tall, sallow-skinned and blessed with a good deal of boyish charm, he has been dubbed "New Labour's answer to Dale Winton". He must deeply regret his party's decision to block unexpected and highly talented MPs like him chicken-running to safer seats. Perhaps understandably he backs PR, because he is unlikely to survive here without it; he also backs Israel and Greek Cyprus, and constituency interests explain that too. His homosexuality led him to heckle the overly heterosexual Labour MP Joe Ashton when Ashton opposed gay sex at 16 if it exposed boys to predatory teachers or children's home carers. His likely Tory nemesis looms in the shape of John Flack, Essex-born in 1957, and educated at Abbs Cross High School, Hornchurch, and externally at Reading University College of Estate Management. Flack is director of a property investment company (owning eight retail chemists until selling them in November 1997). He previously worked as a chartered surveyor. A member of Conservative Way Forward and board member of the Countryside Alliance, he backs small business deregulation and cooks "a memorable curry". He is a Eurosceptic, dislikes high taxation, and, like Twigg, prudently backs Israel and Greek Cyprus.
 |
| Wealthy Achievers, Suburban Areas |
27.72% |
14.99% |
184.85 |
|
| Affluent Greys, Rural Communities |
0.00% |
2.13% |
0.00 |
|
| Prosperous Pensioners, Retirement Areas |
6.14% |
2.49% |
246.91 |
|
| Affluent Executives, Family Areas |
0.00% |
4.43% |
0.00 |
|
| Well-Off Workers, Family Areas |
0.60% |
7.27% |
8.24 |
|
| Affluent Urbanites, Town & City Areas |
12.30% |
2.56% |
479.49 |
|
| Prosperous Professionals, Metropolitan Areas |
17.18% |
2.04% |
841.80 |
|
| Better-Off Executives, Inner City Areas |
2.15% |
3.94% |
54.47 |
|
| Comfortable Middle Agers, Mature Home Owning Areas |
5.30% |
13.04% |
40.64 |
|
| Skilled Workers, Home Owning Areas |
2.23% |
12.70% |
17.52 |
|
| New Home Owners, Mature Communities |
0.87% |
8.14% |
10.67 |
|
| White Collar Workers, Better-Off Multi Ethnic Areas |
20.27% |
4.02% |
504.03 |
|
| Older People, Less Prosperous Areas |
0.59% |
3.19% |
18.44 |
|
| Council Estate Residents, Better-Off Homes |
1.67% |
11.31% |
14.72 |
|
| Council Estate Residents, High Unemployment |
2.90% |
3.06% |
94.67 |
|
| Council Estate Residents, Greatest Hardship |
0.00% |
2.52% |
0.00 |
|
| People in Multi-Ethnic, Low-Income Areas |
0.00% |
2.10% |
0.00 |
|
| Unclassified |
0.10% |
0.06% |
165.96 |
|
|
 |
 |
 |
| £0-5K |
3.97% |
9.41% |
42.18 |
|
| £5-10K |
8.79% |
16.63% |
52.84 |
|
| £10-15K |
11.29% |
16.58% |
68.12 |
|
| £15-20K |
11.52% |
13.58% |
84.80 |
|
| £20-25K |
10.56% |
10.39% |
101.60 |
|
| £25-30K |
9.17% |
7.77% |
117.90 |
|
| £30-35K |
7.73% |
5.79% |
133.37 |
|
| £35-40K |
6.41% |
4.33% |
147.88 |
|
| £40-45K |
5.27% |
3.27% |
161.36 |
|
| £45-50K |
4.31% |
2.48% |
173.83 |
|
| £50-55K |
3.53% |
1.90% |
185.34 |
|
| £55-60K |
2.89% |
1.47% |
195.96 |
|
| £60-65K |
2.37% |
1.15% |
205.74 |
|
| £65-70K |
1.95% |
0.91% |
214.76 |
|
| £70-75K |
1.60% |
0.72% |
223.09 |
|
| £75-80K |
1.33% |
0.57% |
230.78 |
|
| £80-85K |
1.10% |
0.46% |
237.89 |
|
| £85-90K |
0.92% |
0.37% |
244.48 |
|
| £90-95K |
0.76% |
0.31% |
250.59 |
|
| £95-100K |
0.64% |
0.25% |
256.26 |
|
| £100K + |
3.80% |
1.34% |
282.81 |
|
|
|

|


|
1992-1997
|
1997-2001
|
|
|
|
| Con |
-16.77% |
| Lab |
18.01% |
| LD |
-3.73% |
|
| Con |
-2.51% |
| Lab |
7.64% |
| LD |
-3.67% |
|
|
 |
Stephen Twigg
Labour hold
|
| Con |
 |
16,181 |
38.61% |
| Lab |
 |
21,727 |
51.84% |
| LD |
 |
2,935 |
7.00% |
| Oth |
 |
1,065 |
2.54% |
| Maj |
 |
5,546 |
13.23% |
| Turn |
 |
41,908 |
63.10% |
|
|
 |
Stephen Twigg
Labour hold
|
| C |
John Flack |
16,181 |
38.61% |
| UK |
Roy Freshwater |
298 |
0.71% |
| G |
Elaine Graham-Leigh |
662 |
1.58% |
| LD |
Wayne Hoban |
2,935 |
7.00% |
| I |
Andrew Malakouna |
105 |
0.25% |
| L |
Stephen Twigg |
21,727 |
51.84% |
|
Candidates representing 6 parties stood for election to this seat.
|
|
 |
Stephen Twigg
Labour gain
|
| Con |
 |
19,137 |
41.13% |
| Lab |
 |
20,570 |
44.21% |
| LD |
 |
4,966 |
10.67% |
| Ref |
 |
1,342 |
2.88% |
| Oth |
 |
518 |
1.11% |
| Maj |
 |
1,433 |
3.08% |
| Turn |
 |
46,533 |
70.72% |
|
|
 |
|
Conservative
|
| Con |
 |
28,390 |
57.90% |
| Lab |
 |
12,845 |
26.20% |
| LD |
 |
7,072 |
14.40% |
| Oth |
 |
695 |
1.40% |
| Maj |
 |
15,545 |
31.70% |
| Turn |
 |
49,002 |
75.26% |
|
|
 |
|

|

