|
Epsom & Ewell
Conservative hold

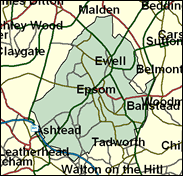
One of those Conservative holds in 1997 which retained a majority of over 10,000 because Labour and the Liberal Democrats shared the opposition vote very evenly, which also militated against tactical voting, Epsom and Ewell is a three quarters middle class, five-sixths owner occupied Surrey seat where those other parties had no substantial areas of success at local government level. Indeed the main party in Epsom is caused by a successful and well oiled Residents machine, which won 27 seats on the council in 1999 to the LDs' 9 and Labour's 3. The Conservatives did not put up a single candidate, which may actually say something about the Residents and about their own strength here. Fighting under their own colours, they will be able to get a new candidate elected in 2001 to replace the very tall Sir Archie Hamilton.

The new Conservative candidate here is Chris Grayling, a balding international management consultant, and former television journalist and producer for BBC and Channel Four. Active in Wimbledon as a Merton Borough councillor since 1998, he was born 1962, and educated at Royal Grammar School, High Wycombe and Sidney Sussex, Cambridge (reading History). He is the author of books on the Bridgewater Canal, the brewer Joseph Holt, English life in the 1920s and Anglo-American relations since 1945; and claims he once hit Dennis Lillee for four.
 |
| Wealthy Achievers, Suburban Areas |
48.91% |
14.99% |
326.23 |
|
| Affluent Greys, Rural Communities |
0.00% |
2.13% |
0.00 |
|
| Prosperous Pensioners, Retirement Areas |
4.85% |
2.49% |
195.26 |
|
| Affluent Executives, Family Areas |
0.67% |
4.43% |
15.04 |
|
| Well-Off Workers, Family Areas |
3.32% |
7.27% |
45.59 |
|
| Affluent Urbanites, Town & City Areas |
3.65% |
2.56% |
142.42 |
|
| Prosperous Professionals, Metropolitan Areas |
3.25% |
2.04% |
159.40 |
|
| Better-Off Executives, Inner City Areas |
1.46% |
3.94% |
37.07 |
|
| Comfortable Middle Agers, Mature Home Owning Areas |
19.16% |
13.04% |
146.94 |
|
| Skilled Workers, Home Owning Areas |
2.97% |
12.70% |
23.35 |
|
| New Home Owners, Mature Communities |
4.98% |
8.14% |
61.13 |
|
| White Collar Workers, Better-Off Multi Ethnic Areas |
0.81% |
4.02% |
20.19 |
|
| Older People, Less Prosperous Areas |
1.18% |
3.19% |
37.12 |
|
| Council Estate Residents, Better-Off Homes |
4.18% |
11.31% |
36.91 |
|
| Council Estate Residents, High Unemployment |
0.13% |
3.06% |
4.13 |
|
| Council Estate Residents, Greatest Hardship |
0.03% |
2.52% |
1.25 |
|
| People in Multi-Ethnic, Low-Income Areas |
0.00% |
2.10% |
0.00 |
|
| Unclassified |
0.45% |
0.06% |
725.64 |
|
|
 |
 |
 |
| £0-5K |
4.35% |
9.41% |
46.18 |
|
| £5-10K |
9.12% |
16.63% |
54.84 |
|
| £10-15K |
11.35% |
16.58% |
68.45 |
|
| £15-20K |
11.38% |
13.58% |
83.81 |
|
| £20-25K |
10.35% |
10.39% |
99.61 |
|
| £25-30K |
8.95% |
7.77% |
115.16 |
|
| £30-35K |
7.54% |
5.79% |
130.09 |
|
| £35-40K |
6.25% |
4.33% |
144.20 |
|
| £40-45K |
5.14% |
3.27% |
157.39 |
|
| £45-50K |
4.21% |
2.48% |
169.65 |
|
| £50-55K |
3.45% |
1.90% |
180.99 |
|
| £55-60K |
2.82% |
1.47% |
191.46 |
|
| £60-65K |
2.32% |
1.15% |
201.10 |
|
| £65-70K |
1.90% |
0.91% |
209.98 |
|
| £70-75K |
1.57% |
0.72% |
218.15 |
|
| £75-80K |
1.30% |
0.57% |
225.67 |
|
| £80-85K |
1.08% |
0.46% |
232.60 |
|
| £85-90K |
0.90% |
0.37% |
238.98 |
|
| £90-95K |
0.75% |
0.31% |
244.87 |
|
| £95-100K |
0.63% |
0.25% |
250.30 |
|
| £100K + |
3.69% |
1.34% |
274.75 |
|
|
|

|


|
1992-1997
|
1997-2001
|
|
|
|
| Con |
-15.48% |
| Lab |
9.25% |
| LD |
-0.35% |
|
| Con |
2.47% |
| Lab |
2.13% |
| LD |
-0.73% |
|
|
 |
Chris Grayling
Conservative hold
|
| Con |
 |
22,430 |
48.09% |
| Lab |
 |
12,350 |
26.48% |
| LD |
 |
10,316 |
22.12% |
| Oth |
 |
1,547 |
3.32% |
| Maj |
 |
10,080 |
21.61% |
| Turn |
 |
46,643 |
62.81% |
|
|
 |
Chris Grayling
Conservative hold
|
| C |
Chris Grayling |
22,430 |
48.09% |
| L |
Charles Mansell |
12,350 |
26.48% |
| LD |
John Vincent |
10,316 |
22.12% |
| UK |
Graham Webster-Gardiner |
1,547 |
3.32% |
|
Candidates representing 4 parties stood for election to this seat.
|
|
 |
Archie Hamilton
Conservative
|
| Con |
 |
24,717 |
45.62% |
| Lab |
 |
13,192 |
24.35% |
| LD |
 |
12,380 |
22.85% |
| Ref |
 |
2,355 |
4.35% |
| Oth |
 |
1,537 |
2.84% |
| Maj |
 |
11,525 |
21.27% |
| Turn |
 |
54,181 |
74.00% |
|
|
 |
|
Conservative
|
| Con |
 |
35,621 |
61.10% |
| Lab |
 |
8,789 |
15.10% |
| LD |
 |
13,561 |
23.20% |
| Oth |
 |
372 |
0.60% |
| Maj |
 |
22,060 |
37.80% |
| Turn |
 |
58,343 |
79.97% |
|
|
 |
|

|

