|
Erith & Thamesmead
Labour hold

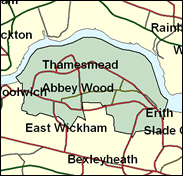
A tough riverside area near the mouth of the Thames, spanning the boundaries between Greenwich and Bexley boroughs, Erith and Thamesmead is safe for the former Woolwich Labour MP formerly known as John Austin Walker. All wards are safe Labour, and the remnants of the SDP vote created by the former Woolwich MP John Cartwright have finally disappeared. This is a mixture of older (Eeith, Northumberland Heath, Abbey Wood) and much newer (Thamesmead) working class territory, with many social problems including some of the worst race relations in the country. The far Right is informally active, but the British National Party only achieved 1.7pc of the democratic vote here in 1997.

John Austin (John Austin-Walker, until dropping his wife's surname in 1997 after their divorce) has rebelled mildly against the Blair government on lone parent benefit cuts, predatory pricing of the Murdoch press, and on means testing incapacity benefit. This is a low strike rate for someone who was Chairman of the Campaign Group as recently as 1995. Born 1944, and educated at Glyn County Grammar School, Epsom, Goldsmith's College and Bristol University, he was a Labour Party organiser and community relations officer and has past links to the semi-Trotskyist Labour Herald. Pro-Kurds, pro-Arabs, anti-nuclear, anti-Serb and pro-Europe (but not a single currency), in March 1996 he apologised to the Chief Whip for speaking on a Sinn Fein platform. Elected here in 1992,he previously clashed as Greenwich Council leader with Neil Kinnock on opposition to rate capping.
 |
| Wealthy Achievers, Suburban Areas |
1.08% |
14.99% |
7.23 |
|
| Affluent Greys, Rural Communities |
0.00% |
2.13% |
0.00 |
|
| Prosperous Pensioners, Retirement Areas |
0.00% |
2.49% |
0.00 |
|
| Affluent Executives, Family Areas |
2.83% |
4.43% |
63.92 |
|
| Well-Off Workers, Family Areas |
0.61% |
7.27% |
8.36 |
|
| Affluent Urbanites, Town & City Areas |
3.38% |
2.56% |
131.71 |
|
| Prosperous Professionals, Metropolitan Areas |
0.00% |
2.04% |
0.00 |
|
| Better-Off Executives, Inner City Areas |
0.92% |
3.94% |
23.31 |
|
| Comfortable Middle Agers, Mature Home Owning Areas |
7.75% |
13.04% |
59.42 |
|
| Skilled Workers, Home Owning Areas |
19.62% |
12.70% |
154.43 |
|
| New Home Owners, Mature Communities |
2.91% |
8.14% |
35.78 |
|
| White Collar Workers, Better-Off Multi Ethnic Areas |
24.45% |
4.02% |
608.02 |
|
| Older People, Less Prosperous Areas |
2.37% |
3.19% |
74.48 |
|
| Council Estate Residents, Better-Off Homes |
19.82% |
11.31% |
175.23 |
|
| Council Estate Residents, High Unemployment |
9.10% |
3.06% |
297.13 |
|
| Council Estate Residents, Greatest Hardship |
2.46% |
2.52% |
97.84 |
|
| People in Multi-Ethnic, Low-Income Areas |
2.70% |
2.10% |
128.45 |
|
| Unclassified |
0.00% |
0.06% |
0.00 |
|
|
 |
 |
 |
| £0-5K |
9.47% |
9.41% |
100.55 |
|
| £5-10K |
16.16% |
16.63% |
97.19 |
|
| £10-15K |
16.55% |
16.58% |
99.82 |
|
| £15-20K |
13.91% |
13.58% |
102.43 |
|
| £20-25K |
10.80% |
10.39% |
103.89 |
|
| £25-30K |
8.10% |
7.77% |
104.16 |
|
| £30-35K |
5.99% |
5.79% |
103.45 |
|
| £35-40K |
4.42% |
4.33% |
102.04 |
|
| £40-45K |
3.27% |
3.27% |
100.14 |
|
| £45-50K |
2.43% |
2.48% |
97.92 |
|
| £50-55K |
1.82% |
1.90% |
95.51 |
|
| £55-60K |
1.37% |
1.47% |
93.02 |
|
| £60-65K |
1.04% |
1.15% |
90.50 |
|
| £65-70K |
0.80% |
0.91% |
88.00 |
|
| £70-75K |
0.62% |
0.72% |
85.55 |
|
| £75-80K |
0.48% |
0.57% |
83.17 |
|
| £80-85K |
0.37% |
0.46% |
80.88 |
|
| £85-90K |
0.29% |
0.37% |
78.68 |
|
| £90-95K |
0.23% |
0.31% |
76.57 |
|
| £95-100K |
0.19% |
0.25% |
74.56 |
|
| £100K + |
0.86% |
1.34% |
63.81 |
|
|
|

|


|
1992-1997
|
1997-2001
|
|
|
|
| Con |
-11.43% |
| Lab |
19.07% |
| LD |
-13.37% |
|
| Con |
5.62% |
| Lab |
-2.79% |
| LD |
-0.63% |
|
|
 |
John Austin
Labour hold
|
| Con |
 |
8,602 |
25.79% |
| Lab |
 |
19,769 |
59.28% |
| LD |
 |
3,800 |
11.39% |
| Oth |
 |
1,180 |
3.54% |
| Maj |
 |
11,167 |
33.48% |
| Turn |
 |
33,351 |
50.25% |
|
|
 |
John Austin
Labour hold
|
| L |
John Austin |
19,769 |
59.28% |
| C |
Mark Brooks |
8,602 |
25.79% |
| SL |
Hardev Dhillon |
1,180 |
3.54% |
| LD |
James Kempton |
3,800 |
11.39% |
|
Candidates representing 4 parties stood for election to this seat.
|
|
 |
John Austin-Walker
Labour
|
| Con |
 |
8,388 |
20.17% |
| Lab |
 |
25,812 |
62.07% |
| LD |
 |
5,001 |
12.03% |
| Ref |
 |
1,394 |
3.35% |
| Oth |
 |
992 |
2.39% |
| Maj |
 |
17,424 |
41.90% |
| Turn |
 |
41,587 |
66.13% |
|
|
 |
|
Labour
|
| Con |
 |
15,615 |
31.60% |
| Lab |
 |
21,245 |
43.00% |
| LD |
 |
12,555 |
25.40% |
| Oth |
|
0 |
0.00% |
| Maj |
 |
5,630 |
11.40% |
| Turn |
 |
49,415 |
74.20% |
|
|
 |
|

|

