|
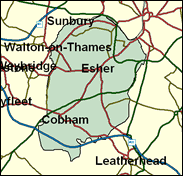
Esher & Walton
Conservative hold

On the evening of 5 December 2000, the moderate and strongly pro-European Conservative MP (now almost a contradiction in terms) Ian Taylor survived a meeting called to instigate his deselection as Tory candidate for the rock-solid Esher and Walton seat in Surrey. He should now take his place among an even more overwhelmingly Euro-sceptic party in the Commons, judging from the selection of new candidates in winnable seats, and although Esher and Walton may have stood with him after the well-publicised skirmishes which brought the intervention of about 40 MPs (from both wings of the party) pleading the cause of a broad church (or of not deselecting sitting MPs), his argument seems lost in the modern (or rather current) Conservative Party.

Ian Taylor, elected for Esher in 1987, is a rare Clarke-supporting One Nation Europhile. He quit Hague's front bench after four months in 1997 over its increasingly Eurosceptic stance, and survived a deselection attempt in December 2000 with an intervention from Ken Clarke, who warned more extreme Eurosceptics in Esher of "very severe consequences" if they dropped him. Born 1945, and educated at Whitley Abbey School, Coventry and Keele University, as a DTI minister in Major's government, he was in charge of promoting IT.
 |
| Wealthy Achievers, Suburban Areas |
49.14% |
14.99% |
327.73 |
|
| Affluent Greys, Rural Communities |
0.00% |
2.13% |
0.00 |
|
| Prosperous Pensioners, Retirement Areas |
1.76% |
2.49% |
70.94 |
|
| Affluent Executives, Family Areas |
1.77% |
4.43% |
40.02 |
|
| Well-Off Workers, Family Areas |
4.18% |
7.27% |
57.43 |
|
| Affluent Urbanites, Town & City Areas |
9.85% |
2.56% |
383.96 |
|
| Prosperous Professionals, Metropolitan Areas |
4.35% |
2.04% |
213.32 |
|
| Better-Off Executives, Inner City Areas |
0.00% |
3.94% |
0.04 |
|
| Comfortable Middle Agers, Mature Home Owning Areas |
18.41% |
13.04% |
141.16 |
|
| Skilled Workers, Home Owning Areas |
2.86% |
12.70% |
22.54 |
|
| New Home Owners, Mature Communities |
2.17% |
8.14% |
26.64 |
|
| White Collar Workers, Better-Off Multi Ethnic Areas |
0.08% |
4.02% |
1.91 |
|
| Older People, Less Prosperous Areas |
1.48% |
3.19% |
46.59 |
|
| Council Estate Residents, Better-Off Homes |
2.85% |
11.31% |
25.20 |
|
| Council Estate Residents, High Unemployment |
1.09% |
3.06% |
35.66 |
|
| Council Estate Residents, Greatest Hardship |
0.00% |
2.52% |
0.00 |
|
| People in Multi-Ethnic, Low-Income Areas |
0.00% |
2.10% |
0.00 |
|
| Unclassified |
0.01% |
0.06% |
9.94 |
|
|
 |
 |
 |
| £0-5K |
3.88% |
9.41% |
41.23 |
|
| £5-10K |
8.03% |
16.63% |
48.27 |
|
| £10-15K |
10.32% |
16.58% |
62.24 |
|
| £15-20K |
10.71% |
13.58% |
78.83 |
|
| £20-25K |
10.04% |
10.39% |
96.57 |
|
| £25-30K |
8.92% |
7.77% |
114.67 |
|
| £30-35K |
7.68% |
5.79% |
132.67 |
|
| £35-40K |
6.51% |
4.33% |
150.25 |
|
| £40-45K |
5.46% |
3.27% |
167.22 |
|
| £45-50K |
4.55% |
2.48% |
183.49 |
|
| £50-55K |
3.79% |
1.90% |
198.98 |
|
| £55-60K |
3.15% |
1.47% |
213.70 |
|
| £60-65K |
2.62% |
1.15% |
227.63 |
|
| £65-70K |
2.18% |
0.91% |
240.80 |
|
| £70-75K |
1.82% |
0.72% |
253.25 |
|
| £75-80K |
1.52% |
0.57% |
264.99 |
|
| £80-85K |
1.28% |
0.46% |
276.08 |
|
| £85-90K |
1.07% |
0.37% |
286.54 |
|
| £90-95K |
0.90% |
0.31% |
296.41 |
|
| £95-100K |
0.76% |
0.25% |
305.73 |
|
| £100K + |
4.74% |
1.34% |
352.77 |
|
|
|

|


|
1992-1997
|
1997-2001
|
|
|
|
| Con |
-10.86% |
| Lab |
5.37% |
| LD |
-1.52% |
|
| Con |
-0.87% |
| Lab |
0.86% |
| LD |
2.11% |
|
|
 |
Ian Taylor
Conservative hold
|
| Con |
 |
22,296 |
48.97% |
| Lab |
 |
10,758 |
23.63% |
| LD |
 |
10,241 |
22.49% |
| Oth |
 |
2,236 |
4.91% |
| Maj |
 |
11,538 |
25.34% |
| Turn |
 |
45,531 |
61.91% |
|
|
 |
Ian Taylor
Conservative hold
|
| UK |
Bernard Collignon |
2,236 |
4.91% |
| LD |
Mark Marsh |
10,241 |
22.49% |
| L |
Joe McGowan |
10,758 |
23.63% |
| C |
Ian Taylor |
22,296 |
48.97% |
|
Candidates representing 4 parties stood for election to this seat.
|
|
 |
Ian Taylor
Conservative
|
| Con |
 |
26,747 |
49.84% |
| Lab |
 |
12,219 |
22.77% |
| LD |
 |
10,937 |
20.38% |
| Ref |
 |
2,904 |
5.41% |
| Oth |
 |
860 |
1.60% |
| Maj |
 |
14,528 |
27.07% |
| Turn |
 |
53,667 |
74.14% |
|
|
 |
|
Conservative
|
| Con |
 |
33,237 |
60.70% |
| Lab |
 |
9,513 |
17.40% |
| LD |
 |
12,013 |
21.90% |
| Oth |
|
0 |
0.00% |
| Maj |
 |
21,224 |
38.80% |
| Turn |
 |
54,763 |
76.49% |
|
|
 |
|

|

