|
Essex North
Conservative hold

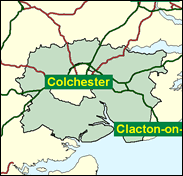
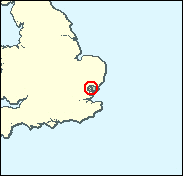
Essex is a large and growing county, and thus it was awarded an extra seat by the Boundary Commission in their 1995 report which came into force at the 1997 General Election. It is arguable that Essex North is that constituency, for it contains what seem to be bits left over from other divisions, most notably the rural areas around Colchester which had to be placed somewhere when that town was united in a single compact urban core. In fact Essex North entirely surrounds Colchester in a doughnut-style boundary solution. The fact that it is a ragbag can also be seen in its name. There are no large towns here, but four with a population of around 7,000: Brightlingsea at the mouth of the river Colne; West Mersea on its island on the Blackwater; Wivenhoe, the site of the most distinguished University of Essex, or in Essex as the political scientist Ivor Crewe who has been its Pro Vice Chancellor says; and Tiptree, known for its manufacture of jam. With the villages in the rural area running from the Blackwater all the way to the Stour on the Suffolk border it is jam today for the Conservative front bencher Bernard Jenkin, and he need not worry about how to preserve his seat in the Commons.

Bernard Jenkin, Shadow Transport Minister, elected first in 1992, is son of former Thatcher Cabinet Minister, Patrick Jenkin, than whom he sees himself as less "cautious" and "more controversial". He says of himself: "I used to be a wet but I'm all right now." But to Tory wet Peter Bottomley his personal and political life is comparable to a large dead fish in a painting by Gail Lilley. Born 1959 and educated at Highgate School, William Ellis School, and Corpus Christi College, Cambridge, he worked as a venture capital manager, and in 1998 voted to lower the homosexual age of consent to 16. As Transport spokesman he wants a full sell-off of the Tube, as Constitution spokesman he opposed devolution. He has been described as "one of the cleverest young dicks on the Eurosceptic benches".
 |
| Wealthy Achievers, Suburban Areas |
42.47% |
14.99% |
283.25 |
|
| Affluent Greys, Rural Communities |
1.79% |
2.13% |
84.06 |
|
| Prosperous Pensioners, Retirement Areas |
2.74% |
2.49% |
110.03 |
|
| Affluent Executives, Family Areas |
5.88% |
4.43% |
132.92 |
|
| Well-Off Workers, Family Areas |
9.71% |
7.27% |
133.43 |
|
| Affluent Urbanites, Town & City Areas |
0.49% |
2.56% |
19.25 |
|
| Prosperous Professionals, Metropolitan Areas |
0.39% |
2.04% |
19.18 |
|
| Better-Off Executives, Inner City Areas |
0.09% |
3.94% |
2.31 |
|
| Comfortable Middle Agers, Mature Home Owning Areas |
23.82% |
13.04% |
182.65 |
|
| Skilled Workers, Home Owning Areas |
4.17% |
12.70% |
32.84 |
|
| New Home Owners, Mature Communities |
5.66% |
8.14% |
69.45 |
|
| White Collar Workers, Better-Off Multi Ethnic Areas |
0.14% |
4.02% |
3.44 |
|
| Older People, Less Prosperous Areas |
0.46% |
3.19% |
14.41 |
|
| Council Estate Residents, Better-Off Homes |
2.02% |
11.31% |
17.89 |
|
| Council Estate Residents, High Unemployment |
0.18% |
3.06% |
5.88 |
|
| Council Estate Residents, Greatest Hardship |
0.00% |
2.52% |
0.00 |
|
| People in Multi-Ethnic, Low-Income Areas |
0.00% |
2.10% |
0.00 |
|
| Unclassified |
0.00% |
0.06% |
0.00 |
|
|
 |
 |
 |
| £0-5K |
7.36% |
9.41% |
78.22 |
|
| £5-10K |
14.34% |
16.63% |
86.21 |
|
| £10-15K |
15.59% |
16.58% |
94.01 |
|
| £15-20K |
13.65% |
13.58% |
100.52 |
|
| £20-25K |
10.98% |
10.39% |
105.60 |
|
| £25-30K |
8.51% |
7.77% |
109.43 |
|
| £30-35K |
6.50% |
5.79% |
112.25 |
|
| £35-40K |
4.95% |
4.33% |
114.29 |
|
| £40-45K |
3.78% |
3.27% |
115.72 |
|
| £45-50K |
2.90% |
2.48% |
116.69 |
|
| £50-55K |
2.23% |
1.90% |
117.31 |
|
| £55-60K |
1.74% |
1.47% |
117.68 |
|
| £60-65K |
1.36% |
1.15% |
117.86 |
|
| £65-70K |
1.07% |
0.91% |
117.91 |
|
| £70-75K |
0.85% |
0.72% |
117.85 |
|
| £75-80K |
0.68% |
0.57% |
117.72 |
|
| £80-85K |
0.54% |
0.46% |
117.54 |
|
| £85-90K |
0.44% |
0.37% |
117.34 |
|
| £90-95K |
0.36% |
0.31% |
117.11 |
|
| £95-100K |
0.29% |
0.25% |
116.87 |
|
| £100K + |
1.55% |
1.34% |
115.60 |
|
|
|

|


|
1992-1997
|
1997-2001
|
|
|
|
| Con |
-13.80% |
| Lab |
14.11% |
| LD |
-2.62% |
|
| Con |
3.55% |
| Lab |
-1.75% |
| LD |
-2.08% |
|
|
 |
Bernard Jenkin
Conservative hold
|
| Con |
 |
21,325 |
47.45% |
| Lab |
 |
14,139 |
31.46% |
| LD |
 |
7,867 |
17.50% |
| Oth |
 |
1,613 |
3.59% |
| Maj |
 |
7,186 |
15.99% |
| Turn |
 |
44,944 |
62.70% |
|
|
 |
Bernard Jenkin
Conservative hold
|
| UK |
George Curtis |
1,613 |
3.59% |
| LD |
Trevor Ellis |
7,867 |
17.50% |
| L |
Philip Hawkins |
14,139 |
31.46% |
| C |
Bernard Jenkin |
21,325 |
47.45% |
|
Candidates representing 4 parties stood for election to this seat.
|
|
 |
Bernard Jenkin
Conservative
|
| Con |
 |
22,480 |
43.90% |
| Lab |
 |
17,004 |
33.21% |
| LD |
 |
10,028 |
19.58% |
| Ref |
|
0 |
0.00% |
| Oth |
 |
1,697 |
3.31% |
| Maj |
 |
5,476 |
10.69% |
| Turn |
 |
51,209 |
75.30% |
|
|
 |
|
Conservative
|
| Con |
 |
31,309 |
57.70% |
| Lab |
 |
10,347 |
19.10% |
| LD |
 |
12,059 |
22.20% |
| Oth |
 |
544 |
1.00% |
| Maj |
 |
19,250 |
35.50% |
| Turn |
 |
54,259 |
81.30% |
|
|
 |
|

|

