|
Exeter
Labour hold

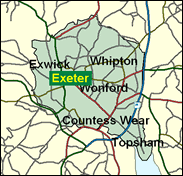
The Exeter constituency exactly covers the local government City of Exeter district. In May 2000, by no means a particularly good time for Labour, they still took control of the council with 22 members to six for the Conservatives and eight for the Liberal Democrats; although in terms of percentage vote it was closer, with Labour taking 33pc to the Conservatives' 28pc and the Liberal Democrats' 25pc (Greens and Others accounted for the rest). This all suggests that Ben Bradshaw will start as favourite to retain this hard-fought marginal, but that the result is once again no foregone conclusion. With any luck it will not be as bitter as it was last time, when Bradshaw was attacked for his sexual orientation by the Right-wing Conservative Adrian Rogers, a former director of the Conservative Family Campaign, and gave back as good as he got.

The former BBC journalist Ben Bradshaw won here in 1997, defeating the Tories' notoriously "homophobic" Dr Adrian Rogers. A parted-down-the-middle Hugh Grant lookalike, he is a vicar's son, born 1960, and educated at Thorpe St Andrew School, Norwich and Sussex University. Though he prefers to be known as "a Labour MP who happens to be gay" he has inevitably been identified as one of six Labour MPs who have declared their homosexuality. He behaves like a very loyal Blairite, favours early entry to a European currency, and has obtained a Commons 'spouse's' pass for his partner.
 |
| Wealthy Achievers, Suburban Areas |
6.45% |
14.99% |
42.99 |
|
| Affluent Greys, Rural Communities |
0.00% |
2.13% |
0.00 |
|
| Prosperous Pensioners, Retirement Areas |
4.87% |
2.49% |
195.96 |
|
| Affluent Executives, Family Areas |
3.23% |
4.43% |
72.94 |
|
| Well-Off Workers, Family Areas |
5.04% |
7.27% |
69.34 |
|
| Affluent Urbanites, Town & City Areas |
7.02% |
2.56% |
273.82 |
|
| Prosperous Professionals, Metropolitan Areas |
1.07% |
2.04% |
52.55 |
|
| Better-Off Executives, Inner City Areas |
6.25% |
3.94% |
158.40 |
|
| Comfortable Middle Agers, Mature Home Owning Areas |
18.47% |
13.04% |
141.68 |
|
| Skilled Workers, Home Owning Areas |
15.21% |
12.70% |
119.75 |
|
| New Home Owners, Mature Communities |
8.77% |
8.14% |
107.75 |
|
| White Collar Workers, Better-Off Multi Ethnic Areas |
8.90% |
4.02% |
221.27 |
|
| Older People, Less Prosperous Areas |
1.71% |
3.19% |
53.75 |
|
| Council Estate Residents, Better-Off Homes |
10.64% |
11.31% |
94.10 |
|
| Council Estate Residents, High Unemployment |
1.30% |
3.06% |
42.54 |
|
| Council Estate Residents, Greatest Hardship |
1.04% |
2.52% |
41.33 |
|
| People in Multi-Ethnic, Low-Income Areas |
0.00% |
2.10% |
0.00 |
|
| Unclassified |
0.01% |
0.06% |
20.26 |
|
|
 |
 |
 |
| £0-5K |
10.69% |
9.41% |
113.59 |
|
| £5-10K |
20.32% |
16.63% |
122.17 |
|
| £10-15K |
19.54% |
16.58% |
117.85 |
|
| £15-20K |
14.86% |
13.58% |
109.37 |
|
| £20-25K |
10.39% |
10.39% |
100.01 |
|
| £25-30K |
7.08% |
7.77% |
91.09 |
|
| £30-35K |
4.81% |
5.79% |
83.09 |
|
| £35-40K |
3.30% |
4.33% |
76.13 |
|
| £40-45K |
2.29% |
3.27% |
70.15 |
|
| £45-50K |
1.61% |
2.48% |
65.03 |
|
| £50-55K |
1.16% |
1.90% |
60.66 |
|
| £55-60K |
0.84% |
1.47% |
56.92 |
|
| £60-65K |
0.62% |
1.15% |
53.70 |
|
| £65-70K |
0.46% |
0.91% |
50.92 |
|
| £70-75K |
0.35% |
0.72% |
48.50 |
|
| £75-80K |
0.27% |
0.57% |
46.38 |
|
| £80-85K |
0.21% |
0.46% |
44.51 |
|
| £85-90K |
0.16% |
0.37% |
42.86 |
|
| £90-95K |
0.13% |
0.31% |
41.39 |
|
| £95-100K |
0.10% |
0.25% |
40.07 |
|
| £100K + |
0.46% |
1.34% |
34.31 |
|
|
|

|


|
1992-1997
|
1997-2001
|
|
|
|
| Con |
-12.50% |
| Lab |
11.32% |
| LD |
-1.38% |
|
| Con |
-1.17% |
| Lab |
2.26% |
| LD |
-5.64% |
|
|
 |
Ben Bradshaw
Labour hold
|
| Con |
 |
14,435 |
27.43% |
| Lab |
 |
26,194 |
49.78% |
| LD |
 |
6,512 |
12.38% |
| Oth |
 |
5,475 |
10.41% |
| Maj |
 |
11,759 |
22.35% |
| Turn |
 |
52,616 |
64.21% |
|
|
 |
Ben Bradshaw
Labour hold
|
| L |
Ben Bradshaw |
26,194 |
49.78% |
| SA |
Francis Choules |
530 |
1.01% |
| LD |
Richard Copus |
6,512 |
12.38% |
| G |
Paul Edwards |
1,240 |
2.36% |
| C |
Anne Jobson |
14,435 |
27.43% |
| Lib |
David Morrish |
2,596 |
4.93% |
| UK |
John Stuart |
1,109 |
2.11% |
|
Candidates representing 7 parties stood for election to this seat.
|
|
 |
Ben Bradshaw
Labour gain
|
| Con |
 |
17,693 |
28.60% |
| Lab |
 |
29,398 |
47.52% |
| LD |
 |
11,148 |
18.02% |
| Ref |
|
0 |
0.00% |
| Oth |
 |
3,625 |
5.86% |
| Maj |
 |
11,705 |
18.92% |
| Turn |
 |
61,864 |
78.16% |
|
|
 |
|
Conservative
|
| Con |
 |
25,693 |
41.10% |
| Lab |
 |
22,629 |
36.20% |
| LD |
 |
12,129 |
19.40% |
| Oth |
 |
1,993 |
3.20% |
| Maj |
 |
3,064 |
4.90% |
| Turn |
 |
62,444 |
81.53% |
|
|
 |
|

|

