|
Falkirk East
Labour hold

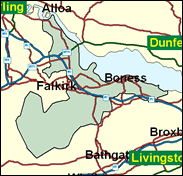
This Scottish seat does not actually include any of the town of Falkirk - it is not that big, not even filling Falkirk West, but has two seats named after it because of its basis for a local government district. Rather East includes Grangemouth with its huge oil refinery, Bo'ness (a shortened form of Borrowstounness) and Carron whose ironworks gave their name to the weapon the carronade (not cannonade) beloved of fanatics on Napoleonic War naval history, the type who read Patrick O'Brian and CS Forester. The battle here in this industrial and working class seat is much less exciting than those recorded in such works of literature. Labour have too many guns for the SNP and other opposition parties.

Michael Connarty, a spiky if calmed-down former semi-hard-left kilted version of Ken Livingstone, was elected here in 1992, having been leader of Stirling Council for 10 years. PPS to Minister-for-only-a-year Tom Clarke, he was born in 1947 and educated at St Patrick's (RC) High School, Coatbridge and Stirling University, and was a teacher of children with learning difficulties for 16 years. A strong devolutionist, he withdrew from his attempt to stand for the Scottish Parliament, unlike his neighbour Dennis Canavan who sought selection and was blocked. Though a left-winger by instinct, he backs the Trident refit at nearby Rosyth where some of his voters work, and has steered clear of rebellion against the Blair government.
 |
| Wealthy Achievers, Suburban Areas |
4.76% |
14.99% |
31.77 |
|
| Affluent Greys, Rural Communities |
0.40% |
2.13% |
18.80 |
|
| Prosperous Pensioners, Retirement Areas |
0.09% |
2.49% |
3.53 |
|
| Affluent Executives, Family Areas |
7.95% |
4.43% |
179.73 |
|
| Well-Off Workers, Family Areas |
11.56% |
7.27% |
158.86 |
|
| Affluent Urbanites, Town & City Areas |
2.36% |
2.56% |
92.03 |
|
| Prosperous Professionals, Metropolitan Areas |
0.01% |
2.04% |
0.33 |
|
| Better-Off Executives, Inner City Areas |
0.06% |
3.94% |
1.55 |
|
| Comfortable Middle Agers, Mature Home Owning Areas |
4.68% |
13.04% |
35.88 |
|
| Skilled Workers, Home Owning Areas |
5.49% |
12.70% |
43.22 |
|
| New Home Owners, Mature Communities |
9.31% |
8.14% |
114.35 |
|
| White Collar Workers, Better-Off Multi Ethnic Areas |
0.03% |
4.02% |
0.86 |
|
| Older People, Less Prosperous Areas |
7.45% |
3.19% |
233.95 |
|
| Council Estate Residents, Better-Off Homes |
33.37% |
11.31% |
295.01 |
|
| Council Estate Residents, High Unemployment |
6.90% |
3.06% |
225.46 |
|
| Council Estate Residents, Greatest Hardship |
5.57% |
2.52% |
221.33 |
|
| People in Multi-Ethnic, Low-Income Areas |
0.00% |
2.10% |
0.00 |
|
| Unclassified |
0.00% |
0.06% |
0.00 |
|
|
 |
 |
 |
| £0-5K |
10.24% |
9.41% |
108.75 |
|
| £5-10K |
18.25% |
16.63% |
109.70 |
|
| £10-15K |
17.87% |
16.58% |
107.76 |
|
| £15-20K |
14.23% |
13.58% |
104.75 |
|
| £20-25K |
10.54% |
10.39% |
101.45 |
|
| £25-30K |
7.63% |
7.77% |
98.13 |
|
| £30-35K |
5.49% |
5.79% |
94.85 |
|
| £35-40K |
3.97% |
4.33% |
91.63 |
|
| £40-45K |
2.89% |
3.27% |
88.46 |
|
| £45-50K |
2.12% |
2.48% |
85.37 |
|
| £50-55K |
1.57% |
1.90% |
82.36 |
|
| £55-60K |
1.17% |
1.47% |
79.44 |
|
| £60-65K |
0.88% |
1.15% |
76.62 |
|
| £65-70K |
0.67% |
0.91% |
73.91 |
|
| £70-75K |
0.51% |
0.72% |
71.30 |
|
| £75-80K |
0.40% |
0.57% |
68.80 |
|
| £80-85K |
0.31% |
0.46% |
66.41 |
|
| £85-90K |
0.24% |
0.37% |
64.13 |
|
| £90-95K |
0.19% |
0.31% |
61.96 |
|
| £95-100K |
0.15% |
0.25% |
59.89 |
|
| £100K + |
0.66% |
1.34% |
48.84 |
|
|
|

|


|
1992-1997
|
1997-2001
|
|
|
|
| Con |
-6.22% |
| Lab |
11.92% |
| LD |
-2.12% |
| SNP |
-4.46% |
|
| Con |
-4.33% |
| Lab |
-1.12% |
| LD |
3.70% |
| SNP |
-0.73% |
|
|
 |
Michael Connarty
Labour hold
|
| Con |
 |
3,252 |
9.65% |
| Lab |
 |
18,536 |
55.00% |
| LD |
 |
2,992 |
8.88% |
| SNP |
 |
7,823 |
23.21% |
| Oth |
 |
1,098 |
3.26% |
| Maj |
 |
10,713 |
31.79% |
| Turn |
 |
33,701 |
58.48% |
|
|
 |
Michael Connarty
Labour hold
|
| L |
Michael Connarty |
18,536 |
55.00% |
| SNP |
Isabel Hutton |
7,823 |
23.21% |
| SL |
Raymond Stead |
373 |
1.11% |
| C |
Bill Stevenson |
3,252 |
9.65% |
| LD |
Karen Utting |
2,992 |
8.88% |
| SSP |
Tony Weir |
725 |
2.15% |
|
Candidates representing 6 parties stood for election to this seat.
|
|
 |
Michael Connarty
Labour
|
| Con |
 |
5,813 |
13.98% |
| Lab |
 |
23,344 |
56.12% |
| LD |
 |
2,153 |
5.18% |
| SNP |
 |
9,959 |
23.94% |
| Ref |
 |
326 |
0.78% |
| Oth |
|
0 |
0.00% |
| Maj |
 |
13,385 |
32.18% |
| Turn |
 |
41,595 |
73.24% |
|
|
 |
|
Labour
|
| Con |
 |
8,771 |
20.20% |
| Lab |
 |
19,183 |
44.20% |
| LD |
 |
3,159 |
7.30% |
| SNP |
 |
12,327 |
28.40% |
| Oth |
|
0 |
0.00% |
| Maj |
 |
6,856 |
15.80% |
| Turn |
 |
43,440 |
76.56% |
|
|
 |
|

|

