|
Fareham
Conservative hold

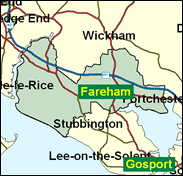
Lining the Solent and Southampton Water, proceeding up the north east bank thereof as far as the river Hamble, Fareham constituncy contains the affluent territory featured as the location of the TV series Howard's Way, a melodrama set among the boating and yachting set. The fashionable Warsash and Sarisbury are here, and the growing Locks Heath; but also more ordinary residential areas in Fareham itself, Portchester and elsewhere. The seat is over 85pc owner occupied and 99pc white, and like its neighbour Gosport more Conservative than its class structure indicates, although unlike Gosport it is more middle class than average. This all adds up to: very Conservative.

Mark Hoban, County Durham-born, but Fareham-based, is the new Conservative candidate here. A chartered accountant, born 1964, educated at St Leonard's (RC) Comprehensive, Durham and LSE, he has worked with Price Waterhouse Coopers or its predecessor companies since graduation, currently advising banks and businesses on flotations and takeovers. In 1997 he fought the very safe Labour seat of South Shields, coming, as he engagingly puts it, "second". His Euroscepticism, strong belief in the free market, light regulation and low tax, sounds well to the right of the retiring MP, Sir Peter Lloyd.
 |
| Wealthy Achievers, Suburban Areas |
33.01% |
14.99% |
220.19 |
|
| Affluent Greys, Rural Communities |
0.01% |
2.13% |
0.29 |
|
| Prosperous Pensioners, Retirement Areas |
2.54% |
2.49% |
102.29 |
|
| Affluent Executives, Family Areas |
15.40% |
4.43% |
348.05 |
|
| Well-Off Workers, Family Areas |
12.77% |
7.27% |
175.56 |
|
| Affluent Urbanites, Town & City Areas |
0.30% |
2.56% |
11.78 |
|
| Prosperous Professionals, Metropolitan Areas |
0.03% |
2.04% |
1.54 |
|
| Better-Off Executives, Inner City Areas |
0.00% |
3.94% |
0.00 |
|
| Comfortable Middle Agers, Mature Home Owning Areas |
16.88% |
13.04% |
129.45 |
|
| Skilled Workers, Home Owning Areas |
5.94% |
12.70% |
46.73 |
|
| New Home Owners, Mature Communities |
6.46% |
8.14% |
79.30 |
|
| White Collar Workers, Better-Off Multi Ethnic Areas |
0.41% |
4.02% |
10.27 |
|
| Older People, Less Prosperous Areas |
1.96% |
3.19% |
61.62 |
|
| Council Estate Residents, Better-Off Homes |
4.19% |
11.31% |
37.01 |
|
| Council Estate Residents, High Unemployment |
0.04% |
3.06% |
1.40 |
|
| Council Estate Residents, Greatest Hardship |
0.00% |
2.52% |
0.00 |
|
| People in Multi-Ethnic, Low-Income Areas |
0.00% |
2.10% |
0.00 |
|
| Unclassified |
0.05% |
0.06% |
87.19 |
|
|
 |
|
|
| £0-5K |
5.56% |
9.41% |
59.04 |
|
| £5-10K |
12.83% |
16.63% |
77.12 |
|
| £10-15K |
15.19% |
16.58% |
91.63 |
|
| £15-20K |
13.94% |
13.58% |
102.64 |
|
| £20-25K |
11.51% |
10.39% |
110.77 |
|
| £25-30K |
9.07% |
7.77% |
116.68 |
|
| £30-35K |
7.00% |
5.79% |
120.88 |
|
| £35-40K |
5.36% |
4.33% |
123.78 |
|
| £40-45K |
4.10% |
3.27% |
125.67 |
|
| £45-50K |
3.15% |
2.48% |
126.79 |
|
| £50-55K |
2.42% |
1.90% |
127.30 |
|
| £55-60K |
1.88% |
1.47% |
127.35 |
|
| £60-65K |
1.46% |
1.15% |
127.03 |
|
| £65-70K |
1.15% |
0.91% |
126.43 |
|
| £70-75K |
0.90% |
0.72% |
125.62 |
|
| £75-80K |
0.72% |
0.57% |
124.63 |
|
| £80-85K |
0.57% |
0.46% |
123.52 |
|
| £85-90K |
0.46% |
0.37% |
122.32 |
|
| £90-95K |
0.37% |
0.31% |
121.04 |
|
| £95-100K |
0.30% |
0.25% |
119.71 |
|
| £100K + |
1.48% |
1.34% |
109.85 |
|
|
|
|


|
1992-1997
|
1997-2001
|
|
|
|
| Con |
-13.77% |
| Lab |
12.08% |
| LD |
-3.59% |
|
| Con |
1.48% |
| Lab |
5.50% |
| LD |
-0.41% |
|
|
|
Mark Hoban
Conservative hold
|
| Con |
 |
21,389 |
48.31% |
| Lab |
 |
14,380 |
32.48% |
| LD |
 |
8,503 |
19.21% |
| Oth |
|
0 |
0.00% |
| Maj |
 |
7,009 |
15.83% |
| Turn |
|
44,272 |
60.88% |
|
|
|
Mark Hoban
Conservative hold
|
| L |
James Carr |
14,380 |
32.48% |
| C |
Mark Hoban |
21,389 |
48.31% |
| LD |
Hugh Pritchard |
8,503 |
19.21% |
|
Candidates representing 3 parties stood for election to this seat.
|
|
|
Peter Lloyd
Conservative
|
| Con |
|
24,436 |
46.83% |
| Lab |
|
14,078 |
26.98% |
| LD |
|
10,234 |
19.61% |
| Ref |
 |
2,914 |
5.58% |
| Oth |
 |
515 |
0.99% |
| Maj |
|
10,358 |
19.85% |
| Turn |
|
52,177 |
75.85% |
|
|
|
|
Conservative
|
| Con |
|
32,588 |
60.60% |
| Lab |
|
7,980 |
14.90% |
| LD |
|
12,489 |
23.20% |
| Oth |
|
679 |
1.30% |
| Maj |
|
20,099 |
37.40% |
| Turn |
|
53,736 |
81.32% |
|
|
|
|
|