|
Faversham & Mid Kent
Conservative hold

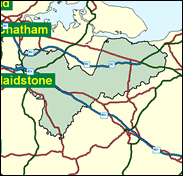
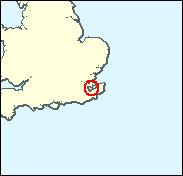
When Kent was granted an extra seat by the Boundary Commission in 1995, this was it. Be not fooled by the name. This constituency does not contain the bulk of either the former seats of Faversham or Mid Kent. Rather it contains territory from four old seats, of which the greatest single element was one not mentioned in the title, Maidstone. The eastern part of that town contains the council housing flavoured wards of Park Wood and Shepway, which Ann Widdecombe will be glad to lose from Maidstone, but they are outvoted by the town of Faversham (most of the seat of that name is in Sittingbourne and Sheppey) and the villages of Mid Kent (most of the former seat of that name is now in Chatham and Aylesford). Labour did well to get within just over 4,000 of the retiring MP Andrew Rowe in 1997, but further progress is unlikely.

New Conservative candidate Hugh Robertson, as a former officer in the Life Guards (1985-95) comes with a traditional pedigree. Born 1962, he attended King's School Canterbury and Sandhurst, and qualified in land management at Reading University. With service in Northern Ireland, the Gulf War, Bosnia and Cyprus, he quit the Army to find a parliamentary seat, joining the Tories in 1995. Currently with Schroeder Investment Management, in 1993 he commanded the Household Cavalry at Trooping the Colour and at the State Opening of Parliament, and will make a suitable, soldierly chum for Julian Brazier next door in Canterbury.
 |
| Wealthy Achievers, Suburban Areas |
26.91% |
14.99% |
179.51 |
|
| Affluent Greys, Rural Communities |
0.70% |
2.13% |
32.90 |
|
| Prosperous Pensioners, Retirement Areas |
1.07% |
2.49% |
42.93 |
|
| Affluent Executives, Family Areas |
8.67% |
4.43% |
195.84 |
|
| Well-Off Workers, Family Areas |
7.78% |
7.27% |
106.96 |
|
| Affluent Urbanites, Town & City Areas |
0.04% |
2.56% |
1.58 |
|
| Prosperous Professionals, Metropolitan Areas |
0.00% |
2.04% |
0.00 |
|
| Better-Off Executives, Inner City Areas |
0.09% |
3.94% |
2.22 |
|
| Comfortable Middle Agers, Mature Home Owning Areas |
22.78% |
13.04% |
174.71 |
|
| Skilled Workers, Home Owning Areas |
8.78% |
12.70% |
69.10 |
|
| New Home Owners, Mature Communities |
8.71% |
8.14% |
106.95 |
|
| White Collar Workers, Better-Off Multi Ethnic Areas |
2.51% |
4.02% |
62.51 |
|
| Older People, Less Prosperous Areas |
2.31% |
3.19% |
72.38 |
|
| Council Estate Residents, Better-Off Homes |
6.29% |
11.31% |
55.64 |
|
| Council Estate Residents, High Unemployment |
0.72% |
3.06% |
23.65 |
|
| Council Estate Residents, Greatest Hardship |
2.64% |
2.52% |
104.64 |
|
| People in Multi-Ethnic, Low-Income Areas |
0.00% |
2.10% |
0.00 |
|
| Unclassified |
0.00% |
0.06% |
7.22 |
|
|
 |
|
|
| £0-5K |
7.74% |
9.41% |
82.25 |
|
| £5-10K |
14.08% |
16.63% |
84.64 |
|
| £10-15K |
14.92% |
16.58% |
89.98 |
|
| £15-20K |
13.05% |
13.58% |
96.06 |
|
| £20-25K |
10.61% |
10.39% |
102.05 |
|
| £25-30K |
8.36% |
7.77% |
107.60 |
|
| £30-35K |
6.52% |
5.79% |
112.58 |
|
| £35-40K |
5.07% |
4.33% |
116.98 |
|
| £40-45K |
3.94% |
3.27% |
120.81 |
|
| £45-50K |
3.08% |
2.48% |
124.11 |
|
| £50-55K |
2.42% |
1.90% |
126.94 |
|
| £55-60K |
1.91% |
1.47% |
129.35 |
|
| £60-65K |
1.51% |
1.15% |
131.39 |
|
| £65-70K |
1.21% |
0.91% |
133.10 |
|
| £70-75K |
0.97% |
0.72% |
134.53 |
|
| £75-80K |
0.78% |
0.57% |
135.71 |
|
| £80-85K |
0.63% |
0.46% |
136.68 |
|
| £85-90K |
0.51% |
0.37% |
137.46 |
|
| £90-95K |
0.42% |
0.31% |
138.08 |
|
| £95-100K |
0.35% |
0.25% |
138.55 |
|
| £100K + |
1.86% |
1.34% |
138.23 |
|
|
|
|


|
1992-1997
|
1997-2001
|
|
|
|
| Con |
-14.82% |
| Lab |
12.97% |
| LD |
-4.63% |
|
| Con |
1.27% |
| Lab |
-0.51% |
| LD |
1.10% |
|
|
|
Hugh Robertson
Conservative hold
|
| Con |
 |
18,739 |
45.65% |
| Lab |
 |
14,556 |
35.46% |
| LD |
 |
5,529 |
13.47% |
| Oth |
 |
2,227 |
5.42% |
| Maj |
 |
4,183 |
10.19% |
| Turn |
|
41,051 |
60.41% |
|
|
|
Hugh Robertson
Conservative hold
|
| L |
Grahame Birchall |
14,556 |
35.46% |
| RRL |
Norman Davidson |
600 |
1.46% |
| UK |
Jim Gascoyne |
828 |
2.02% |
| G |
Penny Kemp |
799 |
1.95% |
| C |
Hugh Robertson |
18,739 |
45.65% |
| LD |
Mike Sole |
5,529 |
13.47% |
|
Candidates representing 6 parties stood for election to this seat.
|
|
|
Andrew Rowe
Conservative
|
| Con |
|
22,016 |
44.38% |
| Lab |
|
17,843 |
35.97% |
| LD |
|
6,138 |
12.37% |
| Ref |
 |
2,073 |
4.18% |
| Oth |
|
1,536 |
3.10% |
| Maj |
|
4,173 |
8.41% |
| Turn |
|
49,606 |
73.50% |
|
|
|
|
Conservative
|
| Con |
|
32,047 |
59.20% |
| Lab |
|
12,448 |
23.00% |
| LD |
|
9,225 |
17.00% |
| Oth |
|
456 |
0.80% |
| Maj |
|
19,599 |
36.20% |
| Turn |
|
54,176 |
81.62% |
|
|
|
|
|