|
Feltham & Heston
Labour hold

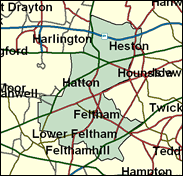
It seems odd to think that the Conservatives won Feltham and Heston in both general elections of the 1980s. It looks a working class seat, with a very strong Asian flavour, and in 1997 it came as no surprise when Alan Keen increased his majority to over 15,000 even against the former Conservative MP Patrick Ground. Almost no-one now thinks Keen will lose next time, so how did the Conservatives ever win here? One reason might be that this seat is not really left-wing (as far more elements of Labour were in the 1980s than now, especially in London). It is rather divided betwen the white working class areas such as Feltham, East Bedfont, and the council housing of Hanworth on the one hand; and the Asian wards of Cranford, Hounslow Heath and Heston where the culture is family oriented and economically conservative, including the owner occupation of housing as a priority. It is said by some that Asian voters like to be on the winning side, which may mean a split vote between the perennially Labour council elections in Hounslow Borough and parliamentary contests - but this is unprovable. In any case both Hounslow and the UK are firmly under moderate Labour governance, and this seat will remain so too.

Alan Keen, elected here in 1992, is part of five Commons husband and wife teams, his wife Ann being MP for the neighbouring seat of Brentford & Isleworth. Less high profile than his wife, he concentrates on local campaigning. Lewisham-born in 1937, but reared in his single mother's home town of Middlesbrough, whose accent he retains, he attended Sir William Turner's School, Redcar and was a football scout for Middlesbrough FC for nearly 30 years. Latterly a 'fire protection consultant', he has also worked as a systems analyst, accountant, and manager of various firms. One of the Commons' quieter MPs, in the 21 months up to February 1999 he made five speeches. He defends first-past-the-post voting, and said of the Jenkins Report in 1998 that he did not think "Blair has any chance of getting this through Parliament".
 |
| Wealthy Achievers, Suburban Areas |
0.51% |
14.99% |
3.41 |
|
| Affluent Greys, Rural Communities |
0.00% |
2.13% |
0.00 |
|
| Prosperous Pensioners, Retirement Areas |
0.29% |
2.49% |
11.74 |
|
| Affluent Executives, Family Areas |
0.42% |
4.43% |
9.56 |
|
| Well-Off Workers, Family Areas |
4.86% |
7.27% |
66.87 |
|
| Affluent Urbanites, Town & City Areas |
2.78% |
2.56% |
108.26 |
|
| Prosperous Professionals, Metropolitan Areas |
0.00% |
2.04% |
0.00 |
|
| Better-Off Executives, Inner City Areas |
0.37% |
3.94% |
9.33 |
|
| Comfortable Middle Agers, Mature Home Owning Areas |
10.04% |
13.04% |
76.98 |
|
| Skilled Workers, Home Owning Areas |
15.18% |
12.70% |
119.50 |
|
| New Home Owners, Mature Communities |
3.84% |
8.14% |
47.12 |
|
| White Collar Workers, Better-Off Multi Ethnic Areas |
24.84% |
4.02% |
617.76 |
|
| Older People, Less Prosperous Areas |
3.96% |
3.19% |
124.26 |
|
| Council Estate Residents, Better-Off Homes |
19.40% |
11.31% |
171.56 |
|
| Council Estate Residents, High Unemployment |
4.26% |
3.06% |
139.15 |
|
| Council Estate Residents, Greatest Hardship |
0.43% |
2.52% |
17.15 |
|
| People in Multi-Ethnic, Low-Income Areas |
8.81% |
2.10% |
419.53 |
|
| Unclassified |
0.00% |
0.06% |
0.00 |
|
|
 |
 |
 |
| £0-5K |
6.86% |
9.41% |
72.90 |
|
| £5-10K |
13.65% |
16.63% |
82.09 |
|
| £10-15K |
15.42% |
16.58% |
93.02 |
|
| £15-20K |
13.92% |
13.58% |
102.49 |
|
| £20-25K |
11.41% |
10.39% |
109.76 |
|
| £25-30K |
8.93% |
7.77% |
114.91 |
|
| £30-35K |
6.85% |
5.79% |
118.30 |
|
| £35-40K |
5.21% |
4.33% |
120.27 |
|
| £40-45K |
3.96% |
3.27% |
121.16 |
|
| £45-50K |
3.01% |
2.48% |
121.24 |
|
| £50-55K |
2.30% |
1.90% |
120.72 |
|
| £55-60K |
1.77% |
1.47% |
119.76 |
|
| £60-65K |
1.36% |
1.15% |
118.48 |
|
| £65-70K |
1.06% |
0.91% |
116.99 |
|
| £70-75K |
0.83% |
0.72% |
115.35 |
|
| £75-80K |
0.65% |
0.57% |
113.61 |
|
| £80-85K |
0.52% |
0.46% |
111.81 |
|
| £85-90K |
0.41% |
0.37% |
109.98 |
|
| £90-95K |
0.33% |
0.31% |
108.15 |
|
| £95-100K |
0.27% |
0.25% |
106.32 |
|
| £100K + |
1.27% |
1.34% |
94.86 |
|
|
|

|


|
1992-1997
|
1997-2001
|
|
|
|
| Con |
-15.95% |
| Lab |
14.21% |
| LD |
-2.45% |
|
| Con |
-2.76% |
| Lab |
-0.54% |
| LD |
4.67% |
|
|
 |
Alan Keen
Labour hold
|
| Con |
 |
8,749 |
24.18% |
| Lab |
 |
21,406 |
59.17% |
| LD |
 |
4,998 |
13.82% |
| Oth |
 |
1,024 |
2.83% |
| Maj |
 |
12,657 |
34.99% |
| Turn |
 |
36,177 |
49.40% |
|
|
 |
Alan Keen
Labour hold
|
| SL |
Surinder Cheema |
651 |
1.80% |
| LD |
Andy Darley |
4,998 |
13.82% |
| LC |
Alan Keen |
21,406 |
59.17% |
| Ind K |
Asa Khaira |
169 |
0.47% |
| C |
Liz Mammatt |
8,749 |
24.18% |
| IP |
Warwick Prachar |
204 |
0.56% |
|
Candidates representing 6 parties stood for election to this seat.
|
|
 |
Alan Keen
Labour
|
| Con |
 |
12,563 |
26.95% |
| Lab |
 |
27,836 |
59.71% |
| LD |
 |
4,264 |
9.15% |
| Ref |
 |
1,099 |
2.36% |
| Oth |
 |
859 |
1.84% |
| Maj |
 |
15,273 |
32.76% |
| Turn |
 |
46,621 |
65.58% |
|
|
 |
|
Labour
|
| Con |
 |
22,894 |
42.90% |
| Lab |
 |
24,294 |
45.50% |
| LD |
 |
6,189 |
11.60% |
| Oth |
|
0 |
0.00% |
| Maj |
 |
1,400 |
2.60% |
| Turn |
 |
53,377 |
72.82% |
|
|
 |
|

|

