|
Fife Central
Labour hold

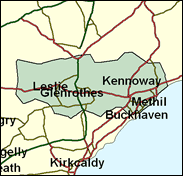
Henry McLeish succeeded the late Donald Dewar to become the second ever First Minister of Scotland in late 2000, and will be moving the whole of his operations to the Scottish Parliament, creating a vacancy in the safe Labour seat of Central Fife, which he will continue to represent as an MSP. This is not so much the old Fife coalfield, as the area dominated by the New Town of Glenrothes, which had grown from 1,150 to a population of 38,800 by 1991. But despite the new estates, new industry, and new sources of economic production it retains the solid Labour traditions in a way a southern English New Town might not have done. The other cluster of population is along the ancient kingdom's coast, not in seaside resorts but in the gritty industrial towns of Buckhaven, Methil and Leven.

In place of Henry McLeish, elevated to First Minister in the Scottish Executive, Labour has kept it local and selected John McDougall, Convenor of Fife Council. A boilermaker by trade and former shop stewards convenor at the local Methil oil rig yard, he was born in 1947, attended Templehall Secondary Modern in Kirkcaldy, Royal Dockyard College, Rosyth, and Fife and Glenrothes colleges, and has been a councillor for twenty years, the last 14 full-time. Self-described as coming from an "ordinary working class family'" he is one of a very small group of ex-manual workers selected to inherit safe Labour seats.
 |
| Wealthy Achievers, Suburban Areas |
2.70% |
14.99% |
18.04 |
|
| Affluent Greys, Rural Communities |
0.03% |
2.13% |
1.61 |
|
| Prosperous Pensioners, Retirement Areas |
0.16% |
2.49% |
6.30 |
|
| Affluent Executives, Family Areas |
6.14% |
4.43% |
138.76 |
|
| Well-Off Workers, Family Areas |
5.57% |
7.27% |
76.58 |
|
| Affluent Urbanites, Town & City Areas |
0.56% |
2.56% |
21.67 |
|
| Prosperous Professionals, Metropolitan Areas |
0.00% |
2.04% |
0.00 |
|
| Better-Off Executives, Inner City Areas |
0.19% |
3.94% |
4.77 |
|
| Comfortable Middle Agers, Mature Home Owning Areas |
1.76% |
13.04% |
13.47 |
|
| Skilled Workers, Home Owning Areas |
14.30% |
12.70% |
112.61 |
|
| New Home Owners, Mature Communities |
9.72% |
8.14% |
119.31 |
|
| White Collar Workers, Better-Off Multi Ethnic Areas |
0.43% |
4.02% |
10.67 |
|
| Older People, Less Prosperous Areas |
9.18% |
3.19% |
288.09 |
|
| Council Estate Residents, Better-Off Homes |
39.35% |
11.31% |
347.91 |
|
| Council Estate Residents, High Unemployment |
5.30% |
3.06% |
173.18 |
|
| Council Estate Residents, Greatest Hardship |
4.61% |
2.52% |
183.11 |
|
| People in Multi-Ethnic, Low-Income Areas |
0.00% |
2.10% |
0.00 |
|
| Unclassified |
0.00% |
0.06% |
0.00 |
|
|
 |
 |
 |
| £0-5K |
11.24% |
9.41% |
119.37 |
|
| £5-10K |
20.32% |
16.63% |
122.14 |
|
| £10-15K |
19.20% |
16.58% |
115.81 |
|
| £15-20K |
14.55% |
13.58% |
107.09 |
|
| £20-25K |
10.22% |
10.39% |
98.33 |
|
| £25-30K |
7.03% |
7.77% |
90.42 |
|
| £30-35K |
4.84% |
5.79% |
83.57 |
|
| £35-40K |
3.37% |
4.33% |
77.72 |
|
| £40-45K |
2.37% |
3.27% |
72.73 |
|
| £45-50K |
1.70% |
2.48% |
68.44 |
|
| £50-55K |
1.23% |
1.90% |
64.71 |
|
| £55-60K |
0.91% |
1.47% |
61.43 |
|
| £60-65K |
0.67% |
1.15% |
58.51 |
|
| £65-70K |
0.51% |
0.91% |
55.88 |
|
| £70-75K |
0.38% |
0.72% |
53.49 |
|
| £75-80K |
0.29% |
0.57% |
51.30 |
|
| £80-85K |
0.23% |
0.46% |
49.27 |
|
| £85-90K |
0.18% |
0.37% |
47.40 |
|
| £90-95K |
0.14% |
0.31% |
45.64 |
|
| £95-100K |
0.11% |
0.25% |
44.00 |
|
| £100K + |
0.48% |
1.34% |
35.64 |
|
|
|

|


|
1992-1997
|
1997-2001
|
|
|
|
| Con |
-8.40% |
| Lab |
7.96% |
| LD |
-0.50% |
| SNP |
0.12% |
|
| Con |
-1.77% |
| Lab |
-2.34% |
| LD |
2.13% |
| SNP |
0.31% |
|
|
 |
John MacDougall
Labour hold
|
| Con |
 |
2,351 |
7.23% |
| Lab |
 |
18,310 |
56.32% |
| LD |
 |
2,775 |
8.54% |
| SNP |
 |
8,235 |
25.33% |
| Oth |
 |
841 |
2.59% |
| Maj |
 |
10,075 |
30.99% |
| Turn |
 |
32,512 |
54.55% |
|
|
 |
John MacDougall
Labour hold
|
| SNP |
David Alexander |
8,235 |
25.33% |
| SSP |
Morag Balfour |
841 |
2.59% |
| C |
Jeremy Balfour |
2,351 |
7.23% |
| L |
John MacDougall |
18,310 |
56.32% |
| LD |
Elizabeth Riches |
2,775 |
8.54% |
|
Candidates representing 5 parties stood for election to this seat.
|
|
 |
Henry McLeish
Labour
|
| Con |
 |
3,669 |
9.00% |
| Lab |
 |
23,912 |
58.66% |
| LD |
 |
2,610 |
6.40% |
| SNP |
 |
10,199 |
25.02% |
| Ref |
 |
375 |
0.92% |
| Oth |
|
0 |
0.00% |
| Maj |
 |
13,713 |
33.64% |
| Turn |
 |
40,765 |
69.90% |
|
|
 |
|
Labour
|
| Con |
 |
7,440 |
17.40% |
| Lab |
 |
21,627 |
50.70% |
| LD |
 |
2,937 |
6.90% |
| SNP |
 |
10,636 |
24.90% |
| Oth |
|
0 |
0.00% |
| Maj |
 |
10,991 |
25.80% |
| Turn |
 |
42,640 |
73.90% |
|
|
 |
|

|

