|
Fife North East
Liberal Democrat hold

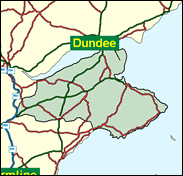
Half the acreage of Fife is contained within the Fife North East constituency, and this is the middle class part, rising to elite in parts, such as the St Andrews of the Royal and Ancient golf course and the medieval university chosen for the education post-Eton of Prince William. It might be thought that all this would be Tory, with the small fishing and tourist burghs of Cupar, Crail, Kilrenny and the Anstruthers (Wester and Easter), Elie, Earlsferry and Newport on Tay, a favoured commuting base for Dundee across the Tay bridge. It was indeed held by the Conservatives until 1987, but Menzies Campbell has built up a formidable position for the Liberal Democrats here, and not only is he very safe himself, beating the Tory by nearly two to one in 1997, but the North East Fife seat was held by a less well known and senior member of his party in the 1999 Scottish Parliament elections.

Here in the steps of H H Asquith (MP 1886-1918) comes the not-quite-so-grand figure of a Mr Speaker manque, Menzies Campbell QC. Elected here in 1987, the Liberal Democrats' earnest and fastidiously-suited Foreign and Defence supremo is an Edinburgh lawyer who rose from Glasgow Labour-voting origins, as a debating and law student contemporary of John Smith and Donald Dewar. Born 1941, and educated at Hillhead High School, Glasgow and Glasgow University, his aloof and wooden style, marriage to a Major General's daughter, and votes against bans on fox hunting, should help make his soon-to-be-local student Prince William, feel at home.
 |
| Wealthy Achievers, Suburban Areas |
15.74% |
14.99% |
104.95 |
|
| Affluent Greys, Rural Communities |
6.42% |
2.13% |
301.78 |
|
| Prosperous Pensioners, Retirement Areas |
2.78% |
2.49% |
111.89 |
|
| Affluent Executives, Family Areas |
5.88% |
4.43% |
132.87 |
|
| Well-Off Workers, Family Areas |
5.30% |
7.27% |
72.85 |
|
| Affluent Urbanites, Town & City Areas |
4.61% |
2.56% |
179.86 |
|
| Prosperous Professionals, Metropolitan Areas |
0.64% |
2.04% |
31.23 |
|
| Better-Off Executives, Inner City Areas |
9.07% |
3.94% |
229.87 |
|
| Comfortable Middle Agers, Mature Home Owning Areas |
12.70% |
13.04% |
97.42 |
|
| Skilled Workers, Home Owning Areas |
5.19% |
12.70% |
40.86 |
|
| New Home Owners, Mature Communities |
10.78% |
8.14% |
132.33 |
|
| White Collar Workers, Better-Off Multi Ethnic Areas |
2.31% |
4.02% |
57.47 |
|
| Older People, Less Prosperous Areas |
4.96% |
3.19% |
155.62 |
|
| Council Estate Residents, Better-Off Homes |
9.97% |
11.31% |
88.16 |
|
| Council Estate Residents, High Unemployment |
2.62% |
3.06% |
85.44 |
|
| Council Estate Residents, Greatest Hardship |
1.05% |
2.52% |
41.52 |
|
| People in Multi-Ethnic, Low-Income Areas |
0.00% |
2.10% |
0.00 |
|
| Unclassified |
0.00% |
0.06% |
0.00 |
|
|
 |
 |
 |
| £0-5K |
8.84% |
9.41% |
93.92 |
|
| £5-10K |
16.14% |
16.63% |
97.03 |
|
| £10-15K |
16.60% |
16.58% |
100.12 |
|
| £15-20K |
13.92% |
13.58% |
102.51 |
|
| £20-25K |
10.81% |
10.39% |
103.99 |
|
| £25-30K |
8.13% |
7.77% |
104.64 |
|
| £30-35K |
6.06% |
5.79% |
104.61 |
|
| £35-40K |
4.51% |
4.33% |
104.08 |
|
| £40-45K |
3.37% |
3.27% |
103.21 |
|
| £45-50K |
2.53% |
2.48% |
102.09 |
|
| £50-55K |
1.92% |
1.90% |
100.80 |
|
| £55-60K |
1.47% |
1.47% |
99.41 |
|
| £60-65K |
1.13% |
1.15% |
97.96 |
|
| £65-70K |
0.87% |
0.91% |
96.46 |
|
| £70-75K |
0.68% |
0.72% |
94.96 |
|
| £75-80K |
0.54% |
0.57% |
93.44 |
|
| £80-85K |
0.43% |
0.46% |
91.94 |
|
| £85-90K |
0.34% |
0.37% |
90.46 |
|
| £90-95K |
0.27% |
0.31% |
88.99 |
|
| £95-100K |
0.22% |
0.25% |
87.56 |
|
| £100K + |
1.06% |
1.34% |
78.68 |
|
|
|

|


|
1992-1997
|
1997-2001
|
|
|
|
| Con |
-12.03% |
| Lab |
4.68% |
| LD |
4.82% |
| SNP |
2.26% |
|
| Con |
-2.87% |
| Lab |
1.11% |
| LD |
0.45% |
| SNP |
-0.50% |
|
|
 |
Menzies Campbell
Liberal Democrat hold
|
| Con |
 |
8,190 |
23.61% |
| Lab |
 |
3,950 |
11.39% |
| LD |
 |
17,926 |
51.67% |
| SNP |
 |
3,596 |
10.37% |
| Oth |
 |
1,030 |
2.97% |
| Maj |
 |
9,736 |
28.06% |
| Turn |
 |
34,692 |
56.05% |
|
|
 |
Menzies Campbell
Liberal Democrat hold
|
| L |
Claire Brennan |
3,950 |
11.39% |
| LD |
Menzies Campbell |
17,926 |
51.67% |
| SNP |
Kris Murray-Browne |
3,596 |
10.37% |
| C |
Mike Scott-Hayward |
8,190 |
23.61% |
| LCA |
Leslie Von Goetz |
420 |
1.21% |
| SSP |
Keith White |
610 |
1.76% |
|
Candidates representing 6 parties stood for election to this seat.
|
|
 |
Menzies Campbell
Liberal Democrat
|
| Con |
 |
11,076 |
26.47% |
| Lab |
 |
4,301 |
10.28% |
| LD |
 |
21,432 |
51.22% |
| SNP |
 |
4,545 |
10.86% |
| Ref |
 |
485 |
1.16% |
| Oth |
|
0 |
0.00% |
| Maj |
 |
10,356 |
24.75% |
| Turn |
 |
41,839 |
71.16% |
|
|
 |
|
Liberal Democrat
|
| Con |
 |
16,129 |
38.50% |
| Lab |
 |
2,337 |
5.60% |
| LD |
 |
19,432 |
46.40% |
| SNP |
 |
3,598 |
8.60% |
| Oth |
 |
379 |
0.90% |
| Maj |
 |
3,303 |
7.90% |
| Turn |
 |
41,875 |
77.20% |
|
|
 |
|

|

