|
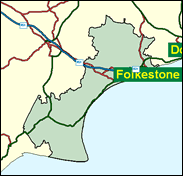
Folkestone & Hythe
Conservative hold

A surprisingly good result for the Conservatives was recorded in 1997, as Michael Howard did not join seven other Cabinet Ministers on the lengthy casualty list of losses in action. The reason was clear. It was not because the Conservative vote held up or that Mr Howard did well personally. His share dropped by 13pc, the national average. However, the beneficiaries of the swing were Labour, and very definitely not the Liberal; Democrats, who slipped back in second place by 8pc when they should have been mounting a very strong challenge. Interestingly, the Referendum party produced one of their best showings here as they picked up 8pc. The candidate was John Aspinall, the controversial gambler and zoo owner (Howletts), who like his party founder Sir James Goldsmith has died of cancer since the election. This is also the site of the late Alan Clark's Saltwood Castle and the late Derek Jarman's cottage within site of Dungeness, with its unique rock garden. Did the Folkestone voters decide to express discontent with Howard by moving to the right, not the centre, as the Liberal Democrats would be perceived to be here? Perhaps their candidate David Laws was just squeezed out between strong personalities and strong national, and nationalist feelings here. In any case, he has done OK for himself; Laws has been selected to replace Paddy Ashdown at Yeovil.

Michael Howard QC, self-retired to the back benches in 1999, his leadership bid having scored 23 votes following Ann Widdecombe's character assassination job on him, was born (1941) Michael Hecht, son of a Lithuanian Jewish dress-shop owner in Gorseinon in the Swansea Valley, and attended Llanelli Grammar School and Peterhouse, Cambridge. With a lawyer's deftness he introduced both the poll tax and, when required, its council tax replacement. Oddly lingering in the Commons with his career spent, he was the most Thatcherite among his Cambridge contemporaries of Clarke, Gummer, Brittan and Lamont, and seen by one observer as "a dark, closed-up person who rarely relaxes and seldom shows warmth". The Liberal Democrats' Peter Carroll hopes to produce the shock result of the night, to match Portillo's fate at Southgate in 1997, by felling Michael Howard on the back of tactical votes. Owner of a family transport business, he graduated from Manchester University with a degree in electronic engineering and previously worked with Philips UK and served in the RAF.
 |
| Wealthy Achievers, Suburban Areas |
16.02% |
14.99% |
106.85 |
|
| Affluent Greys, Rural Communities |
2.92% |
2.13% |
137.37 |
|
| Prosperous Pensioners, Retirement Areas |
12.46% |
2.49% |
501.36 |
|
| Affluent Executives, Family Areas |
2.41% |
4.43% |
54.57 |
|
| Well-Off Workers, Family Areas |
0.91% |
7.27% |
12.51 |
|
| Affluent Urbanites, Town & City Areas |
0.83% |
2.56% |
32.49 |
|
| Prosperous Professionals, Metropolitan Areas |
0.00% |
2.04% |
0.00 |
|
| Better-Off Executives, Inner City Areas |
7.47% |
3.94% |
189.39 |
|
| Comfortable Middle Agers, Mature Home Owning Areas |
21.79% |
13.04% |
167.08 |
|
| Skilled Workers, Home Owning Areas |
12.26% |
12.70% |
96.51 |
|
| New Home Owners, Mature Communities |
7.85% |
8.14% |
96.41 |
|
| White Collar Workers, Better-Off Multi Ethnic Areas |
4.17% |
4.02% |
103.80 |
|
| Older People, Less Prosperous Areas |
1.31% |
3.19% |
41.27 |
|
| Council Estate Residents, Better-Off Homes |
7.59% |
11.31% |
67.07 |
|
| Council Estate Residents, High Unemployment |
0.44% |
3.06% |
14.34 |
|
| Council Estate Residents, Greatest Hardship |
1.56% |
2.52% |
61.86 |
|
| People in Multi-Ethnic, Low-Income Areas |
0.00% |
2.10% |
0.00 |
|
| Unclassified |
0.00% |
0.06% |
0.00 |
|
|
 |
 |
 |
| £0-5K |
9.64% |
9.41% |
102.44 |
|
| £5-10K |
17.09% |
16.63% |
102.76 |
|
| £10-15K |
17.14% |
16.58% |
103.39 |
|
| £15-20K |
13.98% |
13.58% |
102.92 |
|
| £20-25K |
10.56% |
10.39% |
101.58 |
|
| £25-30K |
7.75% |
7.77% |
99.74 |
|
| £30-35K |
5.66% |
5.79% |
97.67 |
|
| £35-40K |
4.14% |
4.33% |
95.54 |
|
| £40-45K |
3.05% |
3.27% |
93.45 |
|
| £45-50K |
2.27% |
2.48% |
91.45 |
|
| £50-55K |
1.71% |
1.90% |
89.56 |
|
| £55-60K |
1.29% |
1.47% |
87.81 |
|
| £60-65K |
0.99% |
1.15% |
86.18 |
|
| £65-70K |
0.77% |
0.91% |
84.67 |
|
| £70-75K |
0.60% |
0.72% |
83.28 |
|
| £75-80K |
0.47% |
0.57% |
81.99 |
|
| £80-85K |
0.37% |
0.46% |
80.80 |
|
| £85-90K |
0.30% |
0.37% |
79.70 |
|
| £90-95K |
0.24% |
0.31% |
78.68 |
|
| £95-100K |
0.19% |
0.25% |
77.72 |
|
| £100K + |
0.98% |
1.34% |
72.98 |
|
|
|

|


|
1992-1997
|
1997-2001
|
|
|
|
| Con |
-13.27% |
| Lab |
12.76% |
| LD |
-8.44% |
|
| Con |
6.00% |
| Lab |
-4.66% |
| LD |
5.28% |
|
|
 |
Michael Howard
Conservative hold
|
| Con |
 |
20,645 |
45.02% |
| Lab |
 |
9,260 |
20.19% |
| LD |
 |
14,738 |
32.14% |
| Oth |
 |
1,212 |
2.64% |
| Maj |
 |
5,907 |
12.88% |
| Turn |
 |
45,855 |
64.13% |
|
|
 |
Michael Howard
Conservative hold
|
| UK |
John Baker |
1,212 |
2.64% |
| LD |
Peter Carroll |
14,738 |
32.14% |
| L |
Albert Catterall |
9,260 |
20.19% |
| C |
Michael Howard |
20,645 |
45.02% |
|
Candidates representing 4 parties stood for election to this seat.
|
|
 |
Michael Howard
Conservative
|
| Con |
 |
20,313 |
39.03% |
| Lab |
 |
12,939 |
24.86% |
| LD |
 |
13,981 |
26.86% |
| Ref |
 |
4,188 |
8.05% |
| Oth |
 |
629 |
1.21% |
| Maj |
 |
6,332 |
12.17% |
| Turn |
 |
52,050 |
73.15% |
|
|
 |
|
Conservative
|
| Con |
 |
27,435 |
52.30% |
| Lab |
 |
6,347 |
12.10% |
| LD |
 |
18,527 |
35.30% |
| Oth |
 |
123 |
0.20% |
| Maj |
 |
8,908 |
17.00% |
| Turn |
 |
52,432 |
81.40% |
|
|
 |
|

|

