|
Fylde
Conservative hold

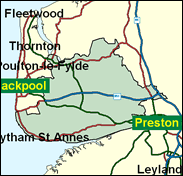
This name should warm the cockles of the heart of a Conservative with historical awareness, for Fylde South sent one of that party's number to parliament with a majorirty of 323, 247 in 1979. Anything like that amount would be a delight in the present straitened circumstances, as in 1997 only one seat (Huntingdon) exceeded even half of it. But the Fylde peninsula in west Lancashire inland from Blackpool remains soundly Conservative, the main communities being the retirement and residential St Anne's and Lytham on the coast, with Kirkham and other affluent villages inland, such as Wrea Green, which received some publicity in 2000 due to alleged squeezing out of locals by wealthy incomers. The Liberal Democrats have always been weak in this part of the world, but even in 1997 Labour could not reach 32pc of the total vote.

Michael Jack, a minister in four different departments under John Major, and a Clarke-supporting Europhile now self-exiled to the back benches after shadowing Agriculture from 1997 to 1998, was first elected here in 1987. Unpretentious, classless and a rare Tory wet, he was born in 1946, educated at Bradford Grammar School and Leicester University and was a food industry manager with Marks & Spencer and Northern Foods.
 |
| Wealthy Achievers, Suburban Areas |
24.55% |
14.99% |
163.77 |
|
| Affluent Greys, Rural Communities |
1.02% |
2.13% |
47.92 |
|
| Prosperous Pensioners, Retirement Areas |
10.13% |
2.49% |
407.39 |
|
| Affluent Executives, Family Areas |
3.00% |
4.43% |
67.90 |
|
| Well-Off Workers, Family Areas |
6.38% |
7.27% |
87.69 |
|
| Affluent Urbanites, Town & City Areas |
1.99% |
2.56% |
77.73 |
|
| Prosperous Professionals, Metropolitan Areas |
0.05% |
2.04% |
2.64 |
|
| Better-Off Executives, Inner City Areas |
4.38% |
3.94% |
111.03 |
|
| Comfortable Middle Agers, Mature Home Owning Areas |
26.01% |
13.04% |
199.48 |
|
| Skilled Workers, Home Owning Areas |
6.94% |
12.70% |
54.60 |
|
| New Home Owners, Mature Communities |
5.12% |
8.14% |
62.90 |
|
| White Collar Workers, Better-Off Multi Ethnic Areas |
3.33% |
4.02% |
82.83 |
|
| Older People, Less Prosperous Areas |
2.51% |
3.19% |
78.65 |
|
| Council Estate Residents, Better-Off Homes |
4.15% |
11.31% |
36.69 |
|
| Council Estate Residents, High Unemployment |
0.40% |
3.06% |
13.07 |
|
| Council Estate Residents, Greatest Hardship |
0.00% |
2.52% |
0.00 |
|
| People in Multi-Ethnic, Low-Income Areas |
0.00% |
2.10% |
0.00 |
|
| Unclassified |
0.04% |
0.06% |
57.58 |
|
|
 |
 |
 |
| £0-5K |
6.98% |
9.41% |
74.13 |
|
| £5-10K |
13.67% |
16.63% |
82.17 |
|
| £10-15K |
15.04% |
16.58% |
90.70 |
|
| £15-20K |
13.37% |
13.58% |
98.46 |
|
| £20-25K |
10.92% |
10.39% |
105.08 |
|
| £25-30K |
8.59% |
7.77% |
110.54 |
|
| £30-35K |
6.66% |
5.79% |
114.94 |
|
| £35-40K |
5.13% |
4.33% |
118.43 |
|
| £40-45K |
3.96% |
3.27% |
121.16 |
|
| £45-50K |
3.06% |
2.48% |
123.26 |
|
| £50-55K |
2.38% |
1.90% |
124.84 |
|
| £55-60K |
1.86% |
1.47% |
126.02 |
|
| £60-65K |
1.46% |
1.15% |
126.85 |
|
| £65-70K |
1.15% |
0.91% |
127.41 |
|
| £70-75K |
0.92% |
0.72% |
127.75 |
|
| £75-80K |
0.74% |
0.57% |
127.92 |
|
| £80-85K |
0.59% |
0.46% |
127.94 |
|
| £85-90K |
0.48% |
0.37% |
127.85 |
|
| £90-95K |
0.39% |
0.31% |
127.66 |
|
| £95-100K |
0.32% |
0.25% |
127.39 |
|
| £100K + |
1.67% |
1.34% |
124.00 |
|
|
|

|


|
1992-1997
|
1997-2001
|
|
|
|
| Con |
-11.33% |
| Lab |
13.05% |
| LD |
-6.09% |
|
| Con |
3.40% |
| Lab |
-0.86% |
| LD |
0.14% |
|
|
 |
Michael Jack
Conservative hold
|
| Con |
 |
23,383 |
52.27% |
| Lab |
 |
13,773 |
30.79% |
| LD |
 |
6,599 |
14.75% |
| Oth |
 |
982 |
2.20% |
| Maj |
 |
9,610 |
21.48% |
| Turn |
 |
44,737 |
61.96% |
|
|
 |
Michael Jack
Conservative hold
|
| LD |
John Begg |
6,599 |
14.75% |
| UK |
Lesley Brown |
982 |
2.20% |
| C |
Michael Jack |
23,383 |
52.27% |
| L |
John Stockton |
13,773 |
30.79% |
|
Candidates representing 4 parties stood for election to this seat.
|
|
 |
Michael Jack
Conservative
|
| Con |
 |
25,443 |
48.87% |
| Lab |
 |
16,480 |
31.65% |
| LD |
 |
7,609 |
14.61% |
| Ref |
 |
2,372 |
4.56% |
| Oth |
 |
163 |
0.31% |
| Maj |
 |
8,963 |
17.21% |
| Turn |
 |
52,067 |
72.94% |
|
|
 |
|
Conservative
|
| Con |
 |
31,849 |
60.20% |
| Lab |
 |
9,827 |
18.60% |
| LD |
 |
10,937 |
20.70% |
| Oth |
 |
268 |
0.50% |
| Maj |
 |
20,912 |
39.50% |
| Turn |
 |
52,881 |
75.13% |
|
|
 |
|

|

