|
Gainsborough
Conservative hold

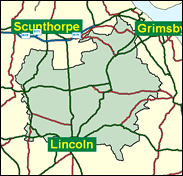
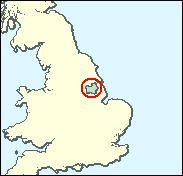
In the north west corner of Lincolnshire one finds the local government district of West Lindsey and the parliamentary constituency of Gainsborough. The River Trent is wide here, and there are often some miles between bridges into Nottinghamshire. Beside the river are to be found the industrial accoutrements of agriculture, such as grain silos and warehouses, and light engineering works manufacturing farm machinery and equipment. Gainsborough has always, since the war, remained Conservative, in the hands of Right-wing incumbents such as the fox hunting Sir Marcus Kimball and now the active and vocal Edward Leigh. At times, perhaps because the Tories have vacated the centre ground, it has seemed likely that a serious Liberal challenge has been developing, as in 1983 for example, but they have flattered only to deceive and steadily dropped back since then. In 1997 Labour took second place, but only narrowly, and with an evenly divided opposition Leigh survived easily. This pattern seems set to continue one more time at least.

Edward Leigh, a gargoyle-faced Roman Catholic right-wing Thatcherite, was elected here in 1983, rose as a minister under Margaret Thatcher but was sacked in 1993 by John Major for encouraging Europhobic Tories to oppose the Maastricht Treaty. Born 1950, son of Sir Neville Leigh KCVO, Clerk to the Privy Council, he attended the Oratory (RC) School, the French Lycee, London and Durham University. Of Margaret Thatcher he has said: "I was with her from the beginning to the end, she has been a dominant influence in my life." But he voted for Heseltine in 1990, saying he'd rather back someone who stabbed her in the front than those who had stabbed her in the back. He is solidly Catholic on divorce, embryo research, abortion and homosexuality.
 |
| Wealthy Achievers, Suburban Areas |
28.10% |
14.99% |
187.41 |
|
| Affluent Greys, Rural Communities |
9.98% |
2.13% |
469.42 |
|
| Prosperous Pensioners, Retirement Areas |
3.80% |
2.49% |
152.71 |
|
| Affluent Executives, Family Areas |
4.26% |
4.43% |
96.18 |
|
| Well-Off Workers, Family Areas |
4.02% |
7.27% |
55.28 |
|
| Affluent Urbanites, Town & City Areas |
0.00% |
2.56% |
0.00 |
|
| Prosperous Professionals, Metropolitan Areas |
0.00% |
2.04% |
0.00 |
|
| Better-Off Executives, Inner City Areas |
0.00% |
3.94% |
0.00 |
|
| Comfortable Middle Agers, Mature Home Owning Areas |
21.76% |
13.04% |
166.89 |
|
| Skilled Workers, Home Owning Areas |
12.48% |
12.70% |
98.27 |
|
| New Home Owners, Mature Communities |
7.74% |
8.14% |
95.10 |
|
| White Collar Workers, Better-Off Multi Ethnic Areas |
1.46% |
4.02% |
36.37 |
|
| Older People, Less Prosperous Areas |
1.58% |
3.19% |
49.50 |
|
| Council Estate Residents, Better-Off Homes |
2.15% |
11.31% |
19.03 |
|
| Council Estate Residents, High Unemployment |
0.10% |
3.06% |
3.16 |
|
| Council Estate Residents, Greatest Hardship |
2.57% |
2.52% |
102.01 |
|
| People in Multi-Ethnic, Low-Income Areas |
0.00% |
2.10% |
0.00 |
|
| Unclassified |
0.00% |
0.06% |
0.00 |
|
|
 |
 |
 |
| £0-5K |
9.63% |
9.41% |
102.27 |
|
| £5-10K |
18.38% |
16.63% |
110.52 |
|
| £10-15K |
18.31% |
16.58% |
110.42 |
|
| £15-20K |
14.54% |
13.58% |
107.07 |
|
| £20-25K |
10.66% |
10.39% |
102.55 |
|
| £25-30K |
7.60% |
7.77% |
97.79 |
|
| £30-35K |
5.40% |
5.79% |
93.19 |
|
| £35-40K |
3.85% |
4.33% |
88.90 |
|
| £40-45K |
2.77% |
3.27% |
84.96 |
|
| £45-50K |
2.02% |
2.48% |
81.37 |
|
| £50-55K |
1.49% |
1.90% |
78.12 |
|
| £55-60K |
1.11% |
1.47% |
75.18 |
|
| £60-65K |
0.83% |
1.15% |
72.51 |
|
| £65-70K |
0.64% |
0.91% |
70.08 |
|
| £70-75K |
0.49% |
0.72% |
67.88 |
|
| £75-80K |
0.38% |
0.57% |
65.87 |
|
| £80-85K |
0.30% |
0.46% |
64.03 |
|
| £85-90K |
0.23% |
0.37% |
62.35 |
|
| £90-95K |
0.19% |
0.31% |
60.80 |
|
| £95-100K |
0.15% |
0.25% |
59.38 |
|
| £100K + |
0.71% |
1.34% |
52.72 |
|
|
|

|


|
1992-1997
|
1997-2001
|
|
|
|
| Con |
-10.31% |
| Lab |
7.90% |
| LD |
2.31% |
|
| Con |
3.12% |
| Lab |
-1.67% |
| LD |
-1.46% |
|
|
 |
Edward Leigh
Conservative hold
|
| Con |
 |
19,555 |
46.21% |
| Lab |
 |
11,484 |
27.14% |
| LD |
 |
11,280 |
26.65% |
| Oth |
|
0 |
0.00% |
| Maj |
 |
8,071 |
19.07% |
| Turn |
 |
42,319 |
64.25% |
|
|
 |
Edward Leigh
Conservative hold
|
| C |
Edward Leigh |
19,555 |
46.21% |
| L |
Alan Rhodes |
11,484 |
27.14% |
| LD |
Steve Taylor |
11,280 |
26.65% |
|
Candidates representing 3 parties stood for election to this seat.
|
|
 |
Edward Leigh
Conservative
|
| Con |
 |
20,593 |
43.09% |
| Lab |
 |
13,767 |
28.80% |
| LD |
 |
13,436 |
28.11% |
| Ref |
|
0 |
0.00% |
| Oth |
|
0 |
0.00% |
| Maj |
 |
6,826 |
14.28% |
| Turn |
 |
47,796 |
74.56% |
|
|
 |
|
Conservative
|
| Con |
 |
26,919 |
53.40% |
| Lab |
 |
10,533 |
20.90% |
| LD |
 |
12,993 |
25.80% |
| Oth |
|
0 |
0.00% |
| Maj |
 |
13,926 |
27.60% |
| Turn |
 |
50,445 |
80.33% |
|
|
 |
|

|

