|
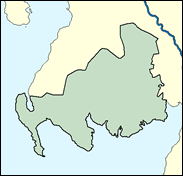
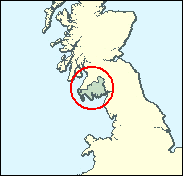
Galloway & Upper Nithsdale
Conservative gain

It looks quite likely that the SNP will retain all their six seats (all won originally from the Conservatives) in the next General Election, but with six new candidates - since the half-dozen elected in 1997 have all entered the Scottish Parliament, which is clearly a higher priority for the Nationalists party. This does not mean that their appeal as Westminster representatives has, as yet, dimmed, although it probably would if there were to be a Conservative revival north of the border - an unlikely prospect at present. Galloway is sometimes regarded as a branch of the Highlands in the far south west corner of Scotland - there are certainly mountains and glens and forests here, and it had the highest proportion of any of the 659 seats of workers employed in agriculture, forestries and fishing. This constituency is one of the SNP's more vulnerable seats, having only been gained in 1997 when Ian Lang joined six other Cabinet Ministers defeated in the rout.

The SNP's second-11 replacement for Alasdair Morgan, retreating to the Edinburgh Parliament, is Malcolm Fleming, who was born 1975, attended Biggar High School and Aberdeen University, read geography, and eventually became Alasdair Morgan's Parliamentary assistant based locally at Dalbeattie. Appropriately he also likes hill-walking and Scottish country dancing.
 |
| Wealthy Achievers, Suburban Areas |
3.07% |
14.99% |
20.50 |
|
| Affluent Greys, Rural Communities |
26.45% |
2.13% |
1,243.75 |
|
| Prosperous Pensioners, Retirement Areas |
3.02% |
2.49% |
121.56 |
|
| Affluent Executives, Family Areas |
0.39% |
4.43% |
8.79 |
|
| Well-Off Workers, Family Areas |
0.74% |
7.27% |
10.19 |
|
| Affluent Urbanites, Town & City Areas |
0.00% |
2.56% |
0.00 |
|
| Prosperous Professionals, Metropolitan Areas |
0.05% |
2.04% |
2.40 |
|
| Better-Off Executives, Inner City Areas |
0.76% |
3.94% |
19.25 |
|
| Comfortable Middle Agers, Mature Home Owning Areas |
12.86% |
13.04% |
98.61 |
|
| Skilled Workers, Home Owning Areas |
7.54% |
12.70% |
59.38 |
|
| New Home Owners, Mature Communities |
15.66% |
8.14% |
192.37 |
|
| White Collar Workers, Better-Off Multi Ethnic Areas |
2.43% |
4.02% |
60.34 |
|
| Older People, Less Prosperous Areas |
4.15% |
3.19% |
130.20 |
|
| Council Estate Residents, Better-Off Homes |
15.08% |
11.31% |
133.35 |
|
| Council Estate Residents, High Unemployment |
2.07% |
3.06% |
67.44 |
|
| Council Estate Residents, Greatest Hardship |
5.73% |
2.52% |
227.59 |
|
| People in Multi-Ethnic, Low-Income Areas |
0.00% |
2.10% |
0.00 |
|
| Unclassified |
0.00% |
0.06% |
0.00 |
|
|
 |
|
|
| £0-5K |
11.44% |
9.41% |
121.50 |
|
| £5-10K |
20.97% |
16.63% |
126.05 |
|
| £10-15K |
19.74% |
16.58% |
119.05 |
|
| £15-20K |
14.78% |
13.58% |
108.80 |
|
| £20-25K |
10.23% |
10.39% |
98.39 |
|
| £25-30K |
6.91% |
7.77% |
88.90 |
|
| £30-35K |
4.67% |
5.79% |
80.59 |
|
| £35-40K |
3.18% |
4.33% |
73.42 |
|
| £40-45K |
2.20% |
3.27% |
67.25 |
|
| £45-50K |
1.54% |
2.48% |
61.93 |
|
| £50-55K |
1.09% |
1.90% |
57.31 |
|
| £55-60K |
0.79% |
1.47% |
53.28 |
|
| £60-65K |
0.57% |
1.15% |
49.74 |
|
| £65-70K |
0.42% |
0.91% |
46.62 |
|
| £70-75K |
0.32% |
0.72% |
43.84 |
|
| £75-80K |
0.24% |
0.57% |
41.35 |
|
| £80-85K |
0.18% |
0.46% |
39.12 |
|
| £85-90K |
0.14% |
0.37% |
37.10 |
|
| £90-95K |
0.11% |
0.31% |
35.28 |
|
| £95-100K |
0.08% |
0.25% |
33.61 |
|
| £100K + |
0.35% |
1.34% |
26.12 |
|
|
|
|


|
1992-1997
|
1997-2001
|
|
|
|
| Con |
-11.48% |
| Lab |
3.33% |
| LD |
-2.17% |
| SNP |
7.51% |
|
| Con |
3.51% |
| Lab |
3.88% |
| LD |
3.87% |
| SNP |
-10.08% |
|
|
|
Peter Duncan
Conservative gain
|
| Con |
 |
12,222 |
34.03% |
| Lab |
 |
7,258 |
20.21% |
| LD |
 |
3,698 |
10.30% |
| SNP |
 |
12,148 |
33.83% |
| Oth |
 |
588 |
1.64% |
| Maj |
 |
74 |
0.21% |
| Turn |
|
35,914 |
68.08% |
|
|
|
Peter Duncan
Conservative gain
|
| C |
Peter Duncan |
12,222 |
34.03% |
| SNP |
Malcolm Fleming |
12,148 |
33.83% |
| SSP |
Andy Harvey |
588 |
1.64% |
| L |
Thomas Sloan |
7,258 |
20.21% |
| LD |
Neil Wallace |
3,698 |
10.30% |
|
Candidates representing 5 parties stood for election to this seat.
|
|
|
Alasdair Morgan
Scottish National Party gain
|
| Con |
|
12,825 |
30.52% |
| Lab |
|
6,861 |
16.33% |
| LD |
|
2,700 |
6.43% |
| SNP |
|
18,449 |
43.91% |
| Ref |
 |
428 |
1.02% |
| Oth |
|
755 |
1.80% |
| Maj |
|
5,624 |
13.38% |
| Turn |
|
42,018 |
79.65% |
|
|
|
|
Conservative
|
| Con |
|
18,173 |
42.00% |
| Lab |
|
5,609 |
13.00% |
| LD |
|
3,721 |
8.60% |
| SNP |
|
15,773 |
36.40% |
| Oth |
|
0 |
0.00% |
| Maj |
|
2,400 |
5.50% |
| Turn |
|
43,276 |
80.92% |
|
|
|
|
|