|
Gateshead East & Washington West
Labour hold

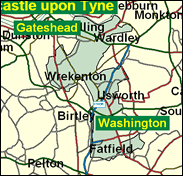
Gateshead West no longer exists as a constituency on its own, but its wards are now to be found in the cross-Tyne inner city seat named Tyne Bridge. Gateshead has lost population like many rugged, low income, high unemployment, redevelopment and slum clearance areas, and its eastern part needs to be placed together with a very different set of neighbourhoods from the post World War Two new town of Washington - to which many of those moved out of substandard housing in the Tyneside conurbation went. Unlike southern new towns, Washington has remained solidly Labour through its experience of the Thatcher years. Its Left-wing politics might surprise a few in the capital of the United States, too.

Joyce Quin, an uncharismatic, hardworking, self-effacing Brown-Owl-in-politics, is one of the Blair government's laterally-sliding middle-rank ministers, from Home Office, to Foreign Office, to Agriculture, having served for nine years as a front bench spokesman before 1997. Born 1944, the great niece of Durham's pre-war Labour MP Joshua Ritson, she was elected here in 1987 after education at Whitley Bay Grammar School, Newcastle University and LSE, and a French and politics lecturing job at Durham University. This, and her time as an MEP, underscore the main theme of her political career, unqualified Europhilia. Amazingly nice for a politician, it has been said "her neatness and size put one in mind of Mrs. Tittlemouse".
 |
| Wealthy Achievers, Suburban Areas |
4.69% |
14.99% |
31.29 |
|
| Affluent Greys, Rural Communities |
0.00% |
2.13% |
0.00 |
|
| Prosperous Pensioners, Retirement Areas |
0.97% |
2.49% |
39.03 |
|
| Affluent Executives, Family Areas |
8.01% |
4.43% |
180.95 |
|
| Well-Off Workers, Family Areas |
8.97% |
7.27% |
123.38 |
|
| Affluent Urbanites, Town & City Areas |
0.58% |
2.56% |
22.54 |
|
| Prosperous Professionals, Metropolitan Areas |
0.10% |
2.04% |
4.69 |
|
| Better-Off Executives, Inner City Areas |
0.00% |
3.94% |
0.00 |
|
| Comfortable Middle Agers, Mature Home Owning Areas |
7.97% |
13.04% |
61.10 |
|
| Skilled Workers, Home Owning Areas |
9.17% |
12.70% |
72.19 |
|
| New Home Owners, Mature Communities |
13.16% |
8.14% |
161.56 |
|
| White Collar Workers, Better-Off Multi Ethnic Areas |
0.45% |
4.02% |
11.23 |
|
| Older People, Less Prosperous Areas |
5.78% |
3.19% |
181.31 |
|
| Council Estate Residents, Better-Off Homes |
29.95% |
11.31% |
264.77 |
|
| Council Estate Residents, High Unemployment |
3.37% |
3.06% |
110.02 |
|
| Council Estate Residents, Greatest Hardship |
6.84% |
2.52% |
271.75 |
|
| People in Multi-Ethnic, Low-Income Areas |
0.00% |
2.10% |
0.00 |
|
| Unclassified |
0.00% |
0.06% |
0.00 |
|
|
 |
 |
 |
| £0-5K |
12.97% |
9.41% |
137.76 |
|
| £5-10K |
21.02% |
16.63% |
126.35 |
|
| £10-15K |
18.69% |
16.58% |
112.74 |
|
| £15-20K |
13.78% |
13.58% |
101.41 |
|
| £20-25K |
9.61% |
10.39% |
92.48 |
|
| £25-30K |
6.64% |
7.77% |
85.43 |
|
| £30-35K |
4.62% |
5.79% |
79.74 |
|
| £35-40K |
3.25% |
4.33% |
75.06 |
|
| £40-45K |
2.32% |
3.27% |
71.13 |
|
| £45-50K |
1.68% |
2.48% |
67.75 |
|
| £50-55K |
1.23% |
1.90% |
64.81 |
|
| £55-60K |
0.92% |
1.47% |
62.20 |
|
| £60-65K |
0.69% |
1.15% |
59.86 |
|
| £65-70K |
0.52% |
0.91% |
57.75 |
|
| £70-75K |
0.40% |
0.72% |
55.82 |
|
| £75-80K |
0.31% |
0.57% |
54.05 |
|
| £80-85K |
0.24% |
0.46% |
52.42 |
|
| £85-90K |
0.19% |
0.37% |
50.90 |
|
| £90-95K |
0.15% |
0.31% |
49.49 |
|
| £95-100K |
0.12% |
0.25% |
48.17 |
|
| £100K + |
0.56% |
1.34% |
41.51 |
|
|
|

|


|
1992-1997
|
1997-2001
|
|
|
|
| Con |
-13.55% |
| Lab |
14.07% |
| LD |
-3.57% |
|
| Con |
0.63% |
| Lab |
-3.93% |
| LD |
4.14% |
|
|
 |
Joyce Quin
Labour hold
|
| Con |
 |
4,970 |
14.79% |
| Lab |
 |
22,903 |
68.13% |
| LD |
 |
4,999 |
14.87% |
| Oth |
 |
743 |
2.21% |
| Maj |
 |
17,904 |
53.26% |
| Turn |
 |
33,615 |
52.49% |
|
|
 |
Joyce Quin
Labour hold
|
| LD |
Ron Beadle |
4,999 |
14.87% |
| C |
Elizabeth Campbell |
4,970 |
14.79% |
| L |
Joyce Quin |
22,903 |
68.13% |
| UK |
Martin Rouse |
743 |
2.21% |
|
Candidates representing 4 parties stood for election to this seat.
|
|
 |
Joyce Quin
Labour
|
| Con |
 |
6,097 |
14.15% |
| Lab |
 |
31,047 |
72.07% |
| LD |
 |
4,622 |
10.73% |
| Ref |
 |
1,315 |
3.05% |
| Oth |
|
0 |
0.00% |
| Maj |
 |
24,950 |
57.91% |
| Turn |
 |
43,081 |
67.19% |
|
|
 |
|
Labour
|
| Con |
 |
13,492 |
27.70% |
| Lab |
 |
28,192 |
58.00% |
| LD |
 |
6,963 |
14.30% |
| Oth |
|
0 |
0.00% |
| Maj |
 |
14,700 |
30.20% |
| Turn |
 |
48,647 |
71.73% |
|
|
 |
|

|

