|
Gedling
Labour hold

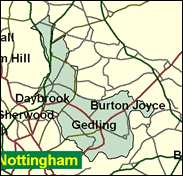
Rather like Broxtowe to the west of Nottingham, Gedling is composed principally of suburbs of the East Midlands city which have long been placed outside its boundaries for local government purposes. Unlike in the case of Broxtowe, there is a place called Gedling, but it is one of the smallest to be dignified with a constituency name of its own, scarcely exceeding the size of a large village. Far more electors are to be found in Carlton (after which the seat was named before 1983), Stapleford and Arnold. Like Broxtowe though, this seat fell to Labour in 1997 - in its case for the first time since the war, as Carlton had resisted Harold Wilson's mini-landslide in 1966. It is just the sort of seat - and they exist in every region - that the Conservatives will absolutely have to regain if there are to form another government at Westminster.

Vernon Coaker came in here in 1997 as a standard issue Labour MP: a school teacher of 20 years standing and a local councillor for 14 years. Focused as an MP on teaching matters, he was born 1953 in London - whose estuarial brogue he retains - and educated at Drayton Manor Grammar School, Hanwell, Warwick University and Trent Polytechnic. The Conservative candidate is Jonathan Bullock. Born 1963, educated at Nottingham High School and Portsmouth Polytechnic, where he studied politics, he runs public relations at the British Road Federation, having previously been an advertising executive, and for three years (1994-97) head of public relations at the Advertising Association - PR for PR. Joining the Party at 18 (1981) he ran against Gerald Kaufman in Manchester Gorton in 1992 and worked on John Bowis' unsuccessful campaign in Battersea in 1997.
 |
| Wealthy Achievers, Suburban Areas |
24.61% |
14.99% |
164.14 |
|
| Affluent Greys, Rural Communities |
0.00% |
2.13% |
0.00 |
|
| Prosperous Pensioners, Retirement Areas |
0.32% |
2.49% |
12.89 |
|
| Affluent Executives, Family Areas |
5.85% |
4.43% |
132.19 |
|
| Well-Off Workers, Family Areas |
8.21% |
7.27% |
112.85 |
|
| Affluent Urbanites, Town & City Areas |
0.90% |
2.56% |
35.20 |
|
| Prosperous Professionals, Metropolitan Areas |
0.05% |
2.04% |
2.41 |
|
| Better-Off Executives, Inner City Areas |
0.08% |
3.94% |
1.92 |
|
| Comfortable Middle Agers, Mature Home Owning Areas |
19.86% |
13.04% |
152.28 |
|
| Skilled Workers, Home Owning Areas |
20.82% |
12.70% |
163.94 |
|
| New Home Owners, Mature Communities |
9.83% |
8.14% |
120.73 |
|
| White Collar Workers, Better-Off Multi Ethnic Areas |
0.07% |
4.02% |
1.85 |
|
| Older People, Less Prosperous Areas |
4.22% |
3.19% |
132.41 |
|
| Council Estate Residents, Better-Off Homes |
3.30% |
11.31% |
29.14 |
|
| Council Estate Residents, High Unemployment |
1.44% |
3.06% |
46.97 |
|
| Council Estate Residents, Greatest Hardship |
0.45% |
2.52% |
17.67 |
|
| People in Multi-Ethnic, Low-Income Areas |
0.00% |
2.10% |
0.00 |
|
| Unclassified |
0.00% |
0.06% |
0.00 |
|
|
 |
 |
 |
| £0-5K |
9.06% |
9.41% |
96.27 |
|
| £5-10K |
17.76% |
16.63% |
106.79 |
|
| £10-15K |
18.15% |
16.58% |
109.49 |
|
| £15-20K |
14.68% |
13.58% |
108.09 |
|
| £20-25K |
10.89% |
10.39% |
104.81 |
|
| £25-30K |
7.84% |
7.77% |
100.83 |
|
| £30-35K |
5.60% |
5.79% |
96.74 |
|
| £35-40K |
4.02% |
4.33% |
92.79 |
|
| £40-45K |
2.91% |
3.27% |
89.10 |
|
| £45-50K |
2.13% |
2.48% |
85.70 |
|
| £50-55K |
1.57% |
1.90% |
82.59 |
|
| £55-60K |
1.18% |
1.47% |
79.76 |
|
| £60-65K |
0.89% |
1.15% |
77.18 |
|
| £65-70K |
0.68% |
0.91% |
74.83 |
|
| £70-75K |
0.52% |
0.72% |
72.69 |
|
| £75-80K |
0.41% |
0.57% |
70.73 |
|
| £80-85K |
0.32% |
0.46% |
68.93 |
|
| £85-90K |
0.25% |
0.37% |
67.27 |
|
| £90-95K |
0.20% |
0.31% |
65.75 |
|
| £95-100K |
0.16% |
0.25% |
64.34 |
|
| £100K + |
0.77% |
1.34% |
57.48 |
|
|
|

|


|
1992-1997
|
1997-2001
|
|
|
|
| Con |
-13.73% |
| Lab |
12.36% |
| LD |
-2.17% |
|
| Con |
-1.16% |
| Lab |
4.33% |
| LD |
0.68% |
|
|
 |
Vernon Coaker
Labour hold
|
| Con |
 |
16,785 |
38.31% |
| Lab |
 |
22,383 |
51.08% |
| LD |
 |
4,648 |
10.61% |
| Oth |
|
0 |
0.00% |
| Maj |
 |
5,598 |
12.78% |
| Turn |
 |
43,816 |
63.93% |
|
|
 |
Vernon Coaker
Labour hold
|
| C |
Jonathan Bullock |
16,785 |
38.31% |
| L |
Vernon Coaker |
22,383 |
51.08% |
| LD |
Tony Gillam |
4,648 |
10.61% |
|
Candidates representing 3 parties stood for election to this seat.
|
|
 |
Vernon Coaker
Labour gain
|
| Con |
 |
20,588 |
39.47% |
| Lab |
 |
24,390 |
46.76% |
| LD |
 |
5,180 |
9.93% |
| Ref |
 |
2,006 |
3.85% |
| Oth |
|
0 |
0.00% |
| Maj |
 |
3,802 |
7.29% |
| Turn |
 |
52,164 |
75.80% |
|
|
 |
|
Conservative
|
| Con |
 |
30,191 |
53.20% |
| Lab |
 |
19,554 |
34.40% |
| LD |
 |
6,863 |
12.10% |
| Oth |
 |
168 |
0.30% |
| Maj |
 |
10,637 |
18.70% |
| Turn |
 |
56,776 |
81.95% |
|
|
 |
|

|

