|
Gillingham
Labour hold

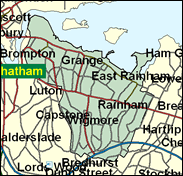
The eight Labour seats in Kent, all gains from the Tories in 1997, include some of their most vulnerable anywhere in Britain, and Gillingham must be regarded as one of the least secure even of these, having been won by Paul Clark by only four per cent after a mighty 16 per cent swing from 1992-7. The seat was coterminous with the Borough of Gillingham, which was abolished in the late 1990s to become part of the new unitary authority of Medway Towns. Due to this change and re-warding, it is difficult to make much of the May 2000 elections there, especially given the Liberal Democrats' strong performance in municipal elections only; but the best estimate places Labour behind the Conservatives in Gillingham wards in 2000 (and actually behind the Lib Dems too, although as they only got 19 per cent in 1997 this is unlikely to be translated into votes in national contests). The conclusion is that the Conservative Tim Butcher is favoured in their No 16 target seat against Labour.

Paul Clark, a rather scrunch-faced, estuarially-accented AEEU apparatchik, involved in TUC educational provision, won here in 1997 as a local born (1957) former local councillor. Educated at Gillingham Grammar School and Keele University, he has been preoccupied as an MP with Thames Corridor issues as one of a rash of Labour MPs who surprisingly swept through North Kent in 1997. As Labour's seventh most unexpected new MP, he must be counted as very exposed to his Tory challenger, Tim Butcher. Born 1957, single, educated at Magna Carta Secondary School, Staines and City of London Polytechnic, he is an underwriting Member of Lloyds and leader (since 1997) of the Tory group on Elmbridge Borough Council. He was Chairman of the rightwing Selsdon Group 1994-98 and is an enthusiast for classic cars and golf.
 |
| Wealthy Achievers, Suburban Areas |
11.49% |
14.99% |
76.65 |
|
| Affluent Greys, Rural Communities |
0.00% |
2.13% |
0.00 |
|
| Prosperous Pensioners, Retirement Areas |
0.11% |
2.49% |
4.47 |
|
| Affluent Executives, Family Areas |
9.01% |
4.43% |
203.54 |
|
| Well-Off Workers, Family Areas |
8.78% |
7.27% |
120.66 |
|
| Affluent Urbanites, Town & City Areas |
0.14% |
2.56% |
5.28 |
|
| Prosperous Professionals, Metropolitan Areas |
0.00% |
2.04% |
0.00 |
|
| Better-Off Executives, Inner City Areas |
0.88% |
3.94% |
22.37 |
|
| Comfortable Middle Agers, Mature Home Owning Areas |
11.69% |
13.04% |
89.65 |
|
| Skilled Workers, Home Owning Areas |
36.56% |
12.70% |
287.83 |
|
| New Home Owners, Mature Communities |
6.50% |
8.14% |
79.83 |
|
| White Collar Workers, Better-Off Multi Ethnic Areas |
3.16% |
4.02% |
78.65 |
|
| Older People, Less Prosperous Areas |
2.79% |
3.19% |
87.47 |
|
| Council Estate Residents, Better-Off Homes |
6.24% |
11.31% |
55.18 |
|
| Council Estate Residents, High Unemployment |
0.72% |
3.06% |
23.64 |
|
| Council Estate Residents, Greatest Hardship |
1.84% |
2.52% |
73.14 |
|
| People in Multi-Ethnic, Low-Income Areas |
0.00% |
2.10% |
0.00 |
|
| Unclassified |
0.09% |
0.06% |
137.99 |
|
|
 |
 |
 |
| £0-5K |
8.17% |
9.41% |
86.82 |
|
| £5-10K |
15.60% |
16.63% |
93.79 |
|
| £10-15K |
16.50% |
16.58% |
99.54 |
|
| £15-20K |
14.04% |
13.58% |
103.38 |
|
| £20-25K |
10.97% |
10.39% |
105.54 |
|
| £25-30K |
8.28% |
7.77% |
106.46 |
|
| £30-35K |
6.17% |
5.79% |
106.51 |
|
| £35-40K |
4.59% |
4.33% |
105.98 |
|
| £40-45K |
3.43% |
3.27% |
105.06 |
|
| £45-50K |
2.58% |
2.48% |
103.89 |
|
| £50-55K |
1.95% |
1.90% |
102.57 |
|
| £55-60K |
1.49% |
1.47% |
101.17 |
|
| £60-65K |
1.15% |
1.15% |
99.73 |
|
| £65-70K |
0.89% |
0.91% |
98.28 |
|
| £70-75K |
0.70% |
0.72% |
96.84 |
|
| £75-80K |
0.55% |
0.57% |
95.43 |
|
| £80-85K |
0.43% |
0.46% |
94.04 |
|
| £85-90K |
0.35% |
0.37% |
92.70 |
|
| £90-95K |
0.28% |
0.31% |
91.39 |
|
| £95-100K |
0.23% |
0.25% |
90.12 |
|
| £100K + |
1.11% |
1.34% |
82.61 |
|
|
|

|


|
1992-1997
|
1997-2001
|
|
|
|
| Con |
-16.08% |
| Lab |
16.03% |
| LD |
-4.46% |
|
| Con |
3.19% |
| Lab |
4.66% |
| LD |
-5.40% |
|
|
 |
Paul Clark
Labour hold
|
| Con |
 |
16,510 |
39.11% |
| Lab |
 |
18,782 |
44.49% |
| LD |
 |
5,755 |
13.63% |
| Oth |
 |
1,165 |
2.76% |
| Maj |
 |
2,272 |
5.38% |
| Turn |
 |
42,212 |
59.54% |
|
|
 |
Paul Clark
Labour hold
|
| C |
Tim Butcher |
16,510 |
39.11% |
| L |
Paul Clark |
18,782 |
44.49% |
| LD |
Jonathan Hunt |
5,755 |
13.63% |
| UK |
Tony Scholefield |
933 |
2.21% |
| SA |
Wynford Vaughan |
232 |
0.55% |
|
Candidates representing 5 parties stood for election to this seat.
|
|
 |
Paul Clark
Labour gain
|
| Con |
 |
18,207 |
35.92% |
| Lab |
 |
20,187 |
39.83% |
| LD |
 |
9,649 |
19.04% |
| Ref |
 |
1,492 |
2.94% |
| Oth |
 |
1,148 |
2.27% |
| Maj |
 |
1,980 |
3.91% |
| Turn |
 |
50,683 |
72.00% |
|
|
 |
|
Conservative
|
| Con |
 |
29,092 |
52.00% |
| Lab |
 |
13,332 |
23.80% |
| LD |
 |
13,150 |
23.50% |
| Oth |
 |
425 |
0.80% |
| Maj |
 |
15,760 |
28.10% |
| Turn |
 |
55,999 |
79.11% |
|
|
 |
|

|

