|
Glasgow Anniesland
Labour hold

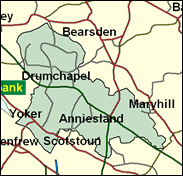
After Donald Dewar's much lamented death in autumn 2000 there were wide expectations that the SNP would press Labour very hard in his Westminster and Holyrood seat, but on 23 November John Robertson held on for Labour with a very comfortable margin indeed, which bodes well not only for his tenure here but also for Labour in contests against the Nationalists elsewhere in industrial central Scotland. Their vote here is granite-hard, typified by the massive post-war estate at Drumchapel on the north west edge of Glasgow, although this wedge shaped seat also passes through inter-war council housing around Knightswood and Yoker to the edge of the elite West End, where Donald Dewar himself lived.

John Robertson followed Donald Dewar as MP here at the November 2000 by-election. Born 1952 and educated at Shawlands Academy, Glasgow, Langside College and Stow College, he worked eventually as a British Telecom customer manager, having earlier been a post office engineer. He joined the Labour Party late (aged 33) but was local chairman by the time of Donald Dewar's death, a reliable local pair of hands with which to see off the SNP.
 |
| Wealthy Achievers, Suburban Areas |
2.77% |
14.99% |
18.47 |
|
| Affluent Greys, Rural Communities |
0.00% |
2.13% |
0.00 |
|
| Prosperous Pensioners, Retirement Areas |
1.88% |
2.49% |
75.51 |
|
| Affluent Executives, Family Areas |
1.22% |
4.43% |
27.48 |
|
| Well-Off Workers, Family Areas |
1.06% |
7.27% |
14.54 |
|
| Affluent Urbanites, Town & City Areas |
4.46% |
2.56% |
173.92 |
|
| Prosperous Professionals, Metropolitan Areas |
7.53% |
2.04% |
369.04 |
|
| Better-Off Executives, Inner City Areas |
4.94% |
3.94% |
125.39 |
|
| Comfortable Middle Agers, Mature Home Owning Areas |
2.38% |
13.04% |
18.23 |
|
| Skilled Workers, Home Owning Areas |
3.00% |
12.70% |
23.64 |
|
| New Home Owners, Mature Communities |
2.70% |
8.14% |
33.18 |
|
| White Collar Workers, Better-Off Multi Ethnic Areas |
0.15% |
4.02% |
3.82 |
|
| Older People, Less Prosperous Areas |
8.59% |
3.19% |
269.58 |
|
| Council Estate Residents, Better-Off Homes |
14.47% |
11.31% |
127.97 |
|
| Council Estate Residents, High Unemployment |
19.99% |
3.06% |
652.80 |
|
| Council Estate Residents, Greatest Hardship |
24.85% |
2.52% |
986.87 |
|
| People in Multi-Ethnic, Low-Income Areas |
0.00% |
2.10% |
0.00 |
|
| Unclassified |
0.00% |
0.06% |
0.00 |
|
|
 |
|
|
| £0-5K |
14.39% |
9.41% |
152.85 |
|
| £5-10K |
21.04% |
16.63% |
126.49 |
|
| £10-15K |
18.00% |
16.58% |
108.56 |
|
| £15-20K |
13.12% |
13.58% |
96.55 |
|
| £20-25K |
9.16% |
10.39% |
88.18 |
|
| £25-30K |
6.38% |
7.77% |
82.10 |
|
| £30-35K |
4.49% |
5.79% |
77.52 |
|
| £35-40K |
3.21% |
4.33% |
73.98 |
|
| £40-45K |
2.32% |
3.27% |
71.16 |
|
| £45-50K |
1.71% |
2.48% |
68.88 |
|
| £50-55K |
1.28% |
1.90% |
66.99 |
|
| £55-60K |
0.96% |
1.47% |
65.40 |
|
| £60-65K |
0.74% |
1.15% |
64.04 |
|
| £65-70K |
0.57% |
0.91% |
62.86 |
|
| £70-75K |
0.44% |
0.72% |
61.82 |
|
| £75-80K |
0.35% |
0.57% |
60.90 |
|
| £80-85K |
0.28% |
0.46% |
60.07 |
|
| £85-90K |
0.22% |
0.37% |
59.32 |
|
| £90-95K |
0.18% |
0.31% |
58.64 |
|
| £95-100K |
0.15% |
0.25% |
58.01 |
|
| £100K + |
0.74% |
1.34% |
54.82 |
|
|
|
|


|
1992-1997
|
1997-2001
|
|
|
|
| Con |
-4.14% |
| Lab |
8.74% |
| LD |
-6.46% |
| SNP |
0.11% |
|
| Con |
-1.53% |
| Lab |
-5.33% |
| LD |
4.90% |
| SNP |
-1.96% |
|
|
|
John Robertson
Labour hold
|
| Con |
 |
2,651 |
9.92% |
| Lab |
 |
15,102 |
56.52% |
| LD |
 |
3,244 |
12.14% |
| SNP |
 |
4,048 |
15.15% |
| Oth |
 |
1,677 |
6.28% |
| Maj |
 |
11,054 |
41.37% |
| Turn |
|
26,722 |
50.14% |
|
|
|
John Robertson
Labour hold
|
| C |
Stewart Connell |
2,651 |
9.92% |
| SSP |
Charlie McCarthy |
1,486 |
5.56% |
| SL |
Katherine McGavigan |
191 |
0.71% |
| LD |
Christopher McGinty |
3,244 |
12.14% |
| L |
John Robertson |
15,102 |
56.52% |
| SNP |
Grant Thomas |
4,048 |
15.15% |
|
Candidates representing 6 parties stood for election to this seat.
|
|
|
|
By Election (23 November 2000)
|
|
Death of Rt Hon Donald Campbell Dewar on 11 October 2000
|
John Robertson
Labour
|
| Con |
|
2,188 |
10.92% |
| Lab |
|
10,359 |
51.71% |
| LD |
|
1,630 |
8.14% |
| SNP |
|
4,202 |
20.98% |
| Oth |
|
1,653 |
8.25% |
| Maj |
|
6,337 |
30.74% |
| Turn |
|
20,032 |
38.08% |
|
|
|
Donald Dewar
Labour
|
| Con |
|
3,881 |
11.46% |
| Lab |
|
20,951 |
61.84% |
| LD |
|
2,453 |
7.24% |
| SNP |
|
5,797 |
17.11% |
| Ref |
 |
84 |
0.25% |
| Oth |
|
713 |
2.10% |
| Maj |
|
15,154 |
44.73% |
| Turn |
|
33,879 |
63.98% |
|
|
|
|
Labour
|
| Con |
|
5,895 |
15.60% |
| Lab |
|
20,000 |
53.10% |
| LD |
|
5,166 |
13.70% |
| SNP |
|
6,411 |
17.00% |
| Oth |
|
213 |
0.60% |
| Maj |
|
13,589 |
36.10% |
| Turn |
|
37,685 |
70.22% |
|
|
|
|
|