|
Glasgow Baillieston
Labour hold

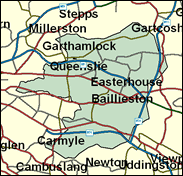
This east end of Glasgow seat is one of the most multiply socially deprived anywhere in Britain. It includes the second highest proportion of council housing (more than 60 per cent) including Easterhouse, notoriously built in the Fifties and Sixties with poor housing stock and virtually no facilities, where despondency and degradation stalk the streets and desperation seems only just round the corner. The communities of Baillieston itself and Mount Vernon, added in 1997 when the seat's name was changed from Provan, seem more healthy, but overall this is an overwhelmingly Labour, and even socialist constituency.

Labour's Jimmy Wray, an astigmatic, low-slung, double-breasted ex-lorry driver, coal man and (when slimmer) chimney sweep - and successful litigant against a former wife's allegation of domestic violence - is proof positive of New Labour's still incomplete takeover by Islington-based smoothies. Born 1935 in the Gorbals, and retaining a distinctive burr, he attended St Bonaventure (RC) Secondary School, and sat on Glasgow and Strathclyde Councils for a regulation 13 years until promoted to a seat in the Commons in 1987. He has introduced legislation on knives and is known for selling watches.
 |
| Wealthy Achievers, Suburban Areas |
2.28% |
14.99% |
15.21 |
|
| Affluent Greys, Rural Communities |
0.00% |
2.13% |
0.00 |
|
| Prosperous Pensioners, Retirement Areas |
0.00% |
2.49% |
0.00 |
|
| Affluent Executives, Family Areas |
2.16% |
4.43% |
48.72 |
|
| Well-Off Workers, Family Areas |
10.02% |
7.27% |
137.79 |
|
| Affluent Urbanites, Town & City Areas |
2.42% |
2.56% |
94.36 |
|
| Prosperous Professionals, Metropolitan Areas |
0.04% |
2.04% |
1.87 |
|
| Better-Off Executives, Inner City Areas |
1.39% |
3.94% |
35.14 |
|
| Comfortable Middle Agers, Mature Home Owning Areas |
3.66% |
13.04% |
28.06 |
|
| Skilled Workers, Home Owning Areas |
2.84% |
12.70% |
22.35 |
|
| New Home Owners, Mature Communities |
2.32% |
8.14% |
28.50 |
|
| White Collar Workers, Better-Off Multi Ethnic Areas |
0.01% |
4.02% |
0.30 |
|
| Older People, Less Prosperous Areas |
4.64% |
3.19% |
145.76 |
|
| Council Estate Residents, Better-Off Homes |
19.58% |
11.31% |
173.14 |
|
| Council Estate Residents, High Unemployment |
8.81% |
3.06% |
287.79 |
|
| Council Estate Residents, Greatest Hardship |
39.82% |
2.52% |
1,581.26 |
|
| People in Multi-Ethnic, Low-Income Areas |
0.00% |
2.10% |
0.07 |
|
| Unclassified |
0.00% |
0.06% |
0.00 |
|
|
 |
 |
 |
| £0-5K |
16.10% |
9.41% |
171.05 |
|
| £5-10K |
22.36% |
16.63% |
134.41 |
|
| £10-15K |
18.44% |
16.58% |
111.21 |
|
| £15-20K |
13.08% |
13.58% |
96.26 |
|
| £20-25K |
8.94% |
10.39% |
85.99 |
|
| £25-30K |
6.10% |
7.77% |
78.41 |
|
| £30-35K |
4.20% |
5.79% |
72.44 |
|
| £35-40K |
2.92% |
4.33% |
67.49 |
|
| £40-45K |
2.06% |
3.27% |
63.22 |
|
| £45-50K |
1.48% |
2.48% |
59.43 |
|
| £50-55K |
1.07% |
1.90% |
56.01 |
|
| £55-60K |
0.78% |
1.47% |
52.90 |
|
| £60-65K |
0.58% |
1.15% |
50.04 |
|
| £65-70K |
0.43% |
0.91% |
47.40 |
|
| £70-75K |
0.32% |
0.72% |
44.97 |
|
| £75-80K |
0.25% |
0.57% |
42.72 |
|
| £80-85K |
0.19% |
0.46% |
40.63 |
|
| £85-90K |
0.14% |
0.37% |
38.70 |
|
| £90-95K |
0.11% |
0.31% |
36.90 |
|
| £95-100K |
0.09% |
0.25% |
35.24 |
|
| £100K + |
0.37% |
1.34% |
27.34 |
|
|
|

|


|
1992-1997
|
1997-2001
|
|
|
|
| Con |
-2.15% |
| Lab |
2.49% |
| LD |
-0.48% |
| SNP |
-3.50% |
|
| Con |
-0.96% |
| Lab |
-4.65% |
| LD |
2.85% |
| SNP |
-0.36% |
|
|
 |
James Wray
Labour hold
|
| Con |
 |
1,580 |
6.79% |
| Lab |
 |
14,200 |
61.05% |
| LD |
 |
1,551 |
6.67% |
| SNP |
 |
4,361 |
18.75% |
| Oth |
 |
1,569 |
6.75% |
| Maj |
 |
9,839 |
42.30% |
| Turn |
 |
23,261 |
47.21% |
|
|
 |
James Wray
Labour hold
|
| C |
David Comrie |
1,580 |
6.79% |
| LD |
Charles Dundas |
1,551 |
6.67% |
| SNP |
Lachlan McNeill |
4,361 |
18.75% |
| SSP |
Jim McVicar |
1,569 |
6.75% |
| L |
James Wray |
14,200 |
61.05% |
|
Candidates representing 5 parties stood for election to this seat.
|
|
 |
James Wray
Labour
|
| Con |
 |
2,468 |
7.75% |
| Lab |
 |
20,925 |
65.69% |
| LD |
 |
1,217 |
3.82% |
| SNP |
 |
6,085 |
19.10% |
| Ref |
 |
188 |
0.59% |
| Oth |
 |
970 |
3.05% |
| Maj |
 |
14,840 |
46.59% |
| Turn |
 |
31,853 |
62.27% |
|
|
 |
|
Labour
|
| Con |
 |
3,448 |
9.90% |
| Lab |
 |
22,030 |
63.20% |
| LD |
 |
1,505 |
4.30% |
| SNP |
 |
7,865 |
22.60% |
| Oth |
|
0 |
0.00% |
| Maj |
 |
14,165 |
40.60% |
| Turn |
 |
34,848 |
66.75% |
|
|
 |
|

|

