|
Glasgow Cathcart
Labour hold

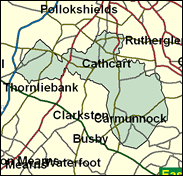
Cathcart was at one time a solidly Conservative division - it should be remembered that in the mid 1950s the Tories could win more than half the seats in Scotland, slightly more than their current score of zero. In Glasgow this was to some extent due to the remnants of anti-Catholic and Irish prejudice which produced an Orange working-class vote, but in Cathcart it was more because this south Glasgow seat included the city's best residential areas after the West End, places such as Newlands, Mount Florida and King's Park. Then in the 1950s and 1960s things began to change, as another of the huge peripheral council estates which are so typical of Scotland's largest city was built on its southern edge, Castlemilk. Teddy Taylor held on as a respected independent Tory until 1979, when he finally lost - to John Maxton, the nephew of Jimmy, the Clydeside ILPer of the 1930s. The secular trend to Labour has continued, and this is now as safe as most of the other Glasgow seats.

Tom Harris, Labour's former Scottish press officer, has been selected to replace the outgoing bearer of a surname famous in Scottish Labour politics, John Maxton. Son of a lorry driver and born 1964, Tom Harris was educated at Napier College, Edinburgh. A journalist from 1986, he worked for the Labour Party from 1990 to 1992, and since then has been a PR man in local government. Like most of Labour's replacements for retiring MPs he comes with local roots, having been chairman of Cathcart CLP. He lists the Middle East among his interests, and his wife, Carolyn, is publications officer with Strathclyde Police.
 |
| Wealthy Achievers, Suburban Areas |
4.24% |
14.99% |
28.31 |
|
| Affluent Greys, Rural Communities |
0.00% |
2.13% |
0.00 |
|
| Prosperous Pensioners, Retirement Areas |
3.79% |
2.49% |
152.35 |
|
| Affluent Executives, Family Areas |
0.50% |
4.43% |
11.35 |
|
| Well-Off Workers, Family Areas |
4.05% |
7.27% |
55.75 |
|
| Affluent Urbanites, Town & City Areas |
12.16% |
2.56% |
474.09 |
|
| Prosperous Professionals, Metropolitan Areas |
2.40% |
2.04% |
117.53 |
|
| Better-Off Executives, Inner City Areas |
9.84% |
3.94% |
249.43 |
|
| Comfortable Middle Agers, Mature Home Owning Areas |
2.19% |
13.04% |
16.82 |
|
| Skilled Workers, Home Owning Areas |
6.86% |
12.70% |
54.03 |
|
| New Home Owners, Mature Communities |
0.93% |
8.14% |
11.48 |
|
| White Collar Workers, Better-Off Multi Ethnic Areas |
5.80% |
4.02% |
144.23 |
|
| Older People, Less Prosperous Areas |
2.23% |
3.19% |
70.07 |
|
| Council Estate Residents, Better-Off Homes |
7.32% |
11.31% |
64.75 |
|
| Council Estate Residents, High Unemployment |
18.16% |
3.06% |
592.99 |
|
| Council Estate Residents, Greatest Hardship |
19.50% |
2.52% |
774.29 |
|
| People in Multi-Ethnic, Low-Income Areas |
0.00% |
2.10% |
0.00 |
|
| Unclassified |
0.01% |
0.06% |
14.87 |
|
|
 |
 |
 |
| £0-5K |
12.61% |
9.41% |
133.90 |
|
| £5-10K |
19.32% |
16.63% |
116.14 |
|
| £10-15K |
17.48% |
16.58% |
105.44 |
|
| £15-20K |
13.38% |
13.58% |
98.51 |
|
| £20-25K |
9.72% |
10.39% |
93.56 |
|
| £25-30K |
6.98% |
7.77% |
89.80 |
|
| £30-35K |
5.03% |
5.79% |
86.85 |
|
| £35-40K |
3.66% |
4.33% |
84.48 |
|
| £40-45K |
2.69% |
3.27% |
82.53 |
|
| £45-50K |
2.01% |
2.48% |
80.87 |
|
| £50-55K |
1.51% |
1.90% |
79.42 |
|
| £55-60K |
1.15% |
1.47% |
78.12 |
|
| £60-65K |
0.89% |
1.15% |
76.92 |
|
| £65-70K |
0.69% |
0.91% |
75.79 |
|
| £70-75K |
0.54% |
0.72% |
74.70 |
|
| £75-80K |
0.42% |
0.57% |
73.64 |
|
| £80-85K |
0.34% |
0.46% |
72.60 |
|
| £85-90K |
0.27% |
0.37% |
71.57 |
|
| £90-95K |
0.22% |
0.31% |
70.54 |
|
| £95-100K |
0.17% |
0.25% |
69.52 |
|
| £100K + |
0.84% |
1.34% |
62.43 |
|
|
|

|


|
1992-1997
|
1997-2001
|
|
|
|
| Con |
-9.05% |
| Lab |
6.87% |
| LD |
-0.45% |
| SNP |
1.17% |
|
| Con |
0.92% |
| Lab |
-1.75% |
| LD |
4.23% |
| SNP |
-5.35% |
|
|
 |
Tom Harris
Labour hold
|
| Con |
 |
3,662 |
13.37% |
| Lab |
 |
14,902 |
54.41% |
| LD |
 |
3,006 |
10.98% |
| SNP |
 |
4,086 |
14.92% |
| Oth |
 |
1,730 |
6.32% |
| Maj |
 |
10,816 |
39.49% |
| Turn |
 |
27,386 |
52.57% |
|
|
 |
Tom Harris
Labour hold
|
| C |
Richard Cook |
3,662 |
13.37% |
| SNP |
Josephine Docherty |
4,086 |
14.92% |
| L |
Tom Harris |
14,902 |
54.41% |
| LD |
Tom Henery |
3,006 |
10.98% |
| SSP |
Ronnie Stevenson |
1,730 |
6.32% |
|
Candidates representing 5 parties stood for election to this seat.
|
|
 |
John Maxton
Labour
|
| Con |
 |
4,248 |
12.45% |
| Lab |
 |
19,158 |
56.17% |
| LD |
 |
2,302 |
6.75% |
| SNP |
 |
6,913 |
20.27% |
| Ref |
 |
344 |
1.01% |
| Oth |
 |
1,145 |
3.36% |
| Maj |
 |
12,245 |
35.90% |
| Turn |
 |
34,110 |
69.17% |
|
|
 |
|
Labour
|
| Con |
 |
8,167 |
21.50% |
| Lab |
 |
18,719 |
49.30% |
| LD |
 |
2,732 |
7.20% |
| SNP |
 |
7,244 |
19.10% |
| Oth |
 |
1,072 |
2.80% |
| Maj |
 |
10,552 |
27.80% |
| Turn |
 |
37,934 |
73.03% |
|
|
 |
|

|

