|
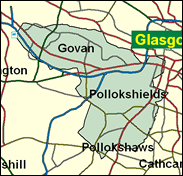
Glasgow Govan
Labour hold

Surely the most vulnerable of Labour's complete set of 10 Glasgow seats, Govan saw a narrow victory by the Muslim MP Mohammed Sarwar over the SNP's Nicola Sturgeon in 1997, and for a while Sarwar's position was threatened in mid-term by a controversy over whether he broke electoral rules in his campaign. However, this has blown over and he may well win again in another General Election contest. Nicola Sturgeon lost again here in the 1999 Scottish Parliament elections, although she was elected for Glasgow as a whole as a top up MSP, so presumably will not stand for Westminster again. Govan has seen disappointment for the SNP twice before, though on different boundaries. Margo Macdonald won a by-election for them in November 1973, but she too found the Labour vote rock hard and resilient, and was an MP for only four months. Another high profile SNP candidate, Jim Sillars, the former Labour and Scottish Labour MP for South Ayrshire, also won a by-election, in 1988, but again Govan reverted to type in 1992. It seems determined to support Labour in the end, come what may.

Mohammad Sarwar is Britain's first Muslim MP, and elected for Scotland's most non-white (11pc, mostly Pakistanis) constituency. Born in Pakistan in 1952, he was a Bhutto-supporting student activist before coming to Scotland aged 24, working as a street trader, eventually becoming a cash-and-carry millionaire. Selected for Govan after a hotly disputed process in 1995-96 and suspended when accused of election fraud immediately after his election in May 1997, he was acquitted in 1999. His Muslim background is reflected in his rebelling against the threat of military action against Iraq and vocal support of the NATO action against Serbia in defence of Kosovo Muslims. He calls also for a plebiscite in Kashmir and defends the beleaguered Govan shipyard.
 |
| Wealthy Achievers, Suburban Areas |
3.85% |
14.99% |
25.69 |
|
| Affluent Greys, Rural Communities |
0.00% |
2.13% |
0.00 |
|
| Prosperous Pensioners, Retirement Areas |
1.66% |
2.49% |
66.66 |
|
| Affluent Executives, Family Areas |
0.37% |
4.43% |
8.26 |
|
| Well-Off Workers, Family Areas |
0.88% |
7.27% |
12.04 |
|
| Affluent Urbanites, Town & City Areas |
10.09% |
2.56% |
393.56 |
|
| Prosperous Professionals, Metropolitan Areas |
11.83% |
2.04% |
579.56 |
|
| Better-Off Executives, Inner City Areas |
15.34% |
3.94% |
388.93 |
|
| Comfortable Middle Agers, Mature Home Owning Areas |
0.00% |
13.04% |
0.00 |
|
| Skilled Workers, Home Owning Areas |
2.58% |
12.70% |
20.32 |
|
| New Home Owners, Mature Communities |
0.31% |
8.14% |
3.75 |
|
| White Collar Workers, Better-Off Multi Ethnic Areas |
1.96% |
4.02% |
48.72 |
|
| Older People, Less Prosperous Areas |
1.27% |
3.19% |
39.87 |
|
| Council Estate Residents, Better-Off Homes |
5.39% |
11.31% |
47.63 |
|
| Council Estate Residents, High Unemployment |
25.62% |
3.06% |
836.55 |
|
| Council Estate Residents, Greatest Hardship |
12.52% |
2.52% |
497.17 |
|
| People in Multi-Ethnic, Low-Income Areas |
6.35% |
2.10% |
302.29 |
|
| Unclassified |
0.00% |
0.06% |
0.00 |
|
|
 |
|
|
| £0-5K |
13.83% |
9.41% |
146.92 |
|
| £5-10K |
19.89% |
16.63% |
119.61 |
|
| £10-15K |
17.41% |
16.58% |
105.02 |
|
| £15-20K |
13.04% |
13.58% |
95.97 |
|
| £20-25K |
9.34% |
10.39% |
89.88 |
|
| £25-30K |
6.65% |
7.77% |
85.58 |
|
| £30-35K |
4.78% |
5.79% |
82.47 |
|
| £35-40K |
3.47% |
4.33% |
80.20 |
|
| £40-45K |
2.56% |
3.27% |
78.53 |
|
| £45-50K |
1.92% |
2.48% |
77.31 |
|
| £50-55K |
1.46% |
1.90% |
76.41 |
|
| £55-60K |
1.12% |
1.47% |
75.76 |
|
| £60-65K |
0.87% |
1.15% |
75.29 |
|
| £65-70K |
0.68% |
0.91% |
74.94 |
|
| £70-75K |
0.54% |
0.72% |
74.69 |
|
| £75-80K |
0.43% |
0.57% |
74.50 |
|
| £80-85K |
0.34% |
0.46% |
74.35 |
|
| £85-90K |
0.28% |
0.37% |
74.23 |
|
| £90-95K |
0.23% |
0.31% |
74.13 |
|
| £95-100K |
0.19% |
0.25% |
74.04 |
|
| £100K + |
0.98% |
1.34% |
72.99 |
|
|
|
|


|
1992-1997
|
1997-2001
|
|
|
|
| Con |
-10.89% |
| Lab |
1.09% |
| LD |
0.34% |
| SNP |
7.45% |
|
| Con |
-0.23% |
| Lab |
5.20% |
| LD |
5.19% |
| SNP |
-11.07% |
|
|
|
Mohammad Sarwar
Labour hold
|
| Con |
 |
2,167 |
8.57% |
| Lab |
 |
12,464 |
49.30% |
| LD |
 |
2,815 |
11.13% |
| SNP |
 |
6,064 |
23.98% |
| Oth |
 |
1,774 |
7.02% |
| Maj |
 |
6,400 |
25.31% |
| Turn |
|
25,284 |
46.76% |
|
|
|
Mohammad Sarwar
Labour hold
|
| CM |
John Foster |
174 |
0.69% |
| SSP |
Willie McGartland |
1,531 |
6.06% |
| C |
Mark Menzies |
2,167 |
8.57% |
| I |
Badar Mirza |
69 |
0.27% |
| SNP |
Karen Neary |
6,064 |
23.98% |
| L |
Mohammad Sarwar |
12,464 |
49.30% |
| LD |
Bob Stewart |
2,815 |
11.13% |
|
Candidates representing 7 parties stood for election to this seat.
|
|
|
Mohammed Sarwar
Labour
|
| Con |
|
2,839 |
8.81% |
| Lab |
|
14,216 |
44.09% |
| LD |
|
1,915 |
5.94% |
| SNP |
|
11,302 |
35.05% |
| Ref |
 |
201 |
0.62% |
| Oth |
|
1,769 |
5.49% |
| Maj |
|
2,914 |
9.04% |
| Turn |
|
32,242 |
64.70% |
|
|
|
|
Labour
|
| Con |
|
7,165 |
19.70% |
| Lab |
|
15,665 |
43.00% |
| LD |
|
2,033 |
5.60% |
| SNP |
|
10,056 |
27.60% |
| Oth |
|
1,475 |
4.10% |
| Maj |
|
5,609 |
15.40% |
| Turn |
|
36,394 |
72.28% |
|
|
|
|
|