|
Glasgow Kelvin
Labour hold

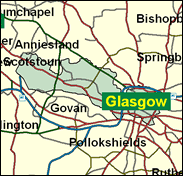
This distinguished constituency includes the heart of the old West End of Glasgow, with the university and the mansions of Kelvinside, and since 1997 much of the city centre, including George Square and Queen Street station, High Street and the cathedral. Its adult residents are more likely to have degrees than any other seat in Scotland, and more than half of the voters are in professional and managerial occupations. There are pockets of working class neighbourhoods as well, of course, as one would find in any central city. Nevertheless, it is a striking demonstration of the alienation of the Scottish elite from the Conservative party that in 1997 the latter obtained a mere 10 per cent of the vote here and finished a miserable fourth, and that it was Labour, in the controversial figure of George Galloway, who won by nearly 10,000 over the SNP.

George Galloway, a deep-tanned sharp-suited globe trotter and MP here (originally Hillhead) since beating Roy "Taffy" Jenkins in 1987, is essentially a one-club politician as a hitcher-on to any passing Arab camel train including that of Saddam Hussein, the PLO, Benazir Bhutto and Mohammad Sarwar. Of his penchant for Saddam Hussein it was said, "if he had infuriated Saddam as much as he did his own party leader, he would now be in a Baghdad basement hanging off the end of a meat hook" (Andrew Rawnsley). Born 1954, and educated at Harris Academy, Dundee, he worked as a manual worker before six years as a Scottish Labour Party organiser, and four years running War on Want. Currently with a PR company operating in the Middle East and India, he strongly backed Scottish devolution. With ability and an effortlessly fluent debating style, his flaw as a career politician lies in his confrontational approach, though he denies that when he asked a fellow Labour MP "why everyone takes an instant dislike to me", the reply was "it saves time".
 |
| Wealthy Achievers, Suburban Areas |
0.21% |
14.99% |
1.38 |
|
| Affluent Greys, Rural Communities |
0.00% |
2.13% |
0.00 |
|
| Prosperous Pensioners, Retirement Areas |
0.32% |
2.49% |
12.71 |
|
| Affluent Executives, Family Areas |
0.00% |
4.43% |
0.00 |
|
| Well-Off Workers, Family Areas |
0.00% |
7.27% |
0.00 |
|
| Affluent Urbanites, Town & City Areas |
8.79% |
2.56% |
342.89 |
|
| Prosperous Professionals, Metropolitan Areas |
11.79% |
2.04% |
577.47 |
|
| Better-Off Executives, Inner City Areas |
41.68% |
3.94% |
1,056.92 |
|
| Comfortable Middle Agers, Mature Home Owning Areas |
0.74% |
13.04% |
5.66 |
|
| Skilled Workers, Home Owning Areas |
2.49% |
12.70% |
19.61 |
|
| New Home Owners, Mature Communities |
0.00% |
8.14% |
0.00 |
|
| White Collar Workers, Better-Off Multi Ethnic Areas |
1.09% |
4.02% |
27.13 |
|
| Older People, Less Prosperous Areas |
0.59% |
3.19% |
18.53 |
|
| Council Estate Residents, Better-Off Homes |
2.10% |
11.31% |
18.54 |
|
| Council Estate Residents, High Unemployment |
26.85% |
3.06% |
876.77 |
|
| Council Estate Residents, Greatest Hardship |
2.22% |
2.52% |
88.30 |
|
| People in Multi-Ethnic, Low-Income Areas |
1.11% |
2.10% |
52.95 |
|
| Unclassified |
0.02% |
0.06% |
38.25 |
|
|
 |
 |
 |
| £0-5K |
10.62% |
9.41% |
112.86 |
|
| £5-10K |
17.68% |
16.63% |
106.32 |
|
| £10-15K |
16.84% |
16.58% |
101.56 |
|
| £15-20K |
13.33% |
13.58% |
98.13 |
|
| £20-25K |
9.95% |
10.39% |
95.71 |
|
| £25-30K |
7.32% |
7.77% |
94.15 |
|
| £30-35K |
5.40% |
5.79% |
93.29 |
|
| £35-40K |
4.03% |
4.33% |
93.01 |
|
| £40-45K |
3.04% |
3.27% |
93.19 |
|
| £45-50K |
2.33% |
2.48% |
93.71 |
|
| £50-55K |
1.80% |
1.90% |
94.49 |
|
| £55-60K |
1.41% |
1.47% |
95.46 |
|
| £60-65K |
1.11% |
1.15% |
96.57 |
|
| £65-70K |
0.89% |
0.91% |
97.78 |
|
| £70-75K |
0.71% |
0.72% |
99.04 |
|
| £75-80K |
0.58% |
0.57% |
100.35 |
|
| £80-85K |
0.47% |
0.46% |
101.66 |
|
| £85-90K |
0.39% |
0.37% |
102.99 |
|
| £90-95K |
0.32% |
0.31% |
104.30 |
|
| £95-100K |
0.26% |
0.25% |
105.59 |
|
| £100K + |
1.52% |
1.34% |
113.36 |
|
|
|

|


|
1992-1997
|
1997-2001
|
|
|
|
| Con |
-2.36% |
| Lab |
4.07% |
| LD |
-4.72% |
| SNP |
2.07% |
|
| Con |
-1.93% |
| Lab |
-6.14% |
| LD |
3.56% |
| SNP |
-4.53% |
|
|
 |
George Galloway
Labour hold
|
| Con |
 |
2,388 |
8.91% |
| Lab |
 |
12,014 |
44.83% |
| LD |
 |
4,754 |
17.74% |
| SNP |
 |
4,513 |
16.84% |
| Oth |
 |
3,133 |
11.69% |
| Maj |
 |
7,260 |
27.09% |
| Turn |
 |
26,802 |
61528.93% |
|
|
 |
George Galloway
Labour hold
|
| L |
George Galloway |
12,014 |
44.83% |
| LD |
Tamsin Mayberry |
4,754 |
17.74% |
| SNP |
Frank Rankin |
4,513 |
16.84% |
| C |
Davina Rankin |
2,388 |
8.91% |
| SSP |
Heather Richie |
1,847 |
6.89% |
| G |
Tim Shand |
1,286 |
4.80% |
|
Candidates representing 6 parties stood for election to this seat.
|
|
 |
George Galloway
Labour
|
| Con |
 |
3,539 |
10.84% |
| Lab |
 |
16,643 |
50.97% |
| LD |
 |
4,629 |
14.18% |
| SNP |
 |
6,978 |
21.37% |
| Ref |
 |
282 |
0.86% |
| Oth |
 |
583 |
1.79% |
| Maj |
 |
9,665 |
29.60% |
| Turn |
 |
32,654 |
56.85% |
|
|
 |
|
Labour
|
| Con |
 |
4,765 |
13.20% |
| Lab |
 |
16,971 |
46.90% |
| LD |
 |
6,848 |
18.90% |
| SNP |
 |
6,982 |
19.30% |
| Oth |
 |
649 |
1.80% |
| Maj |
 |
9,989 |
27.60% |
| Turn |
 |
36,215 |
67.46% |
|
|
 |
|

|

