|
Barnsley East & Mexborough
Labour hold

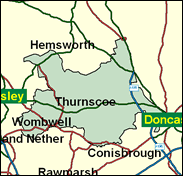
Back in the 1950s and 1960s, if one asked which was the safest Labour seat in England, the most likely reply would have been Hemsworth. This was the seat at the heart of the Yorkshire coalfield where it was said that the Labour votes were weighed not counted. When the metropolitan counties of West and South Yorkshire were created in 1974, the seat of Hemsworth was split in two, and although the town of Hemsworth itself has taken its electorally famous name with it to a West Yorkshire division, more than half its electorate was assigned to this seat, which had the highest Labour majority in percentage terms through the 1980s, and still gave Jeff Ennis a majority of more than 26,000 in 1997. The small towns have high unemployment and look old-fashioned, with little redevelopment.

Jeff Ennis, elected at a 1996 byelection, is a former teacher, born 1952, educated at Hemsworth Grammar School and Redland College, Bristol. With only three former miners left as MPs on the dying Yorkshire coalfield, the best he can do is evoke his miner father and both grandfathers. A very big and burly quiet loyalist, he managed to stop himself resigning as Tessa Jowell's PPS over lone parent benefit cuts in 1997.
 |
| Wealthy Achievers, Suburban Areas |
4.13% |
14.99% |
27.54 |
|
| Affluent Greys, Rural Communities |
0.36% |
2.13% |
17.10 |
|
| Prosperous Pensioners, Retirement Areas |
0.09% |
2.49% |
3.50 |
|
| Affluent Executives, Family Areas |
1.47% |
4.43% |
33.26 |
|
| Well-Off Workers, Family Areas |
10.34% |
7.27% |
142.21 |
|
| Affluent Urbanites, Town & City Areas |
0.00% |
2.56% |
0.00 |
|
| Prosperous Professionals, Metropolitan Areas |
0.00% |
2.04% |
0.00 |
|
| Better-Off Executives, Inner City Areas |
0.00% |
3.94% |
0.00 |
|
| Comfortable Middle Agers, Mature Home Owning Areas |
7.35% |
13.04% |
56.38 |
|
| Skilled Workers, Home Owning Areas |
28.03% |
12.70% |
220.63 |
|
| New Home Owners, Mature Communities |
22.61% |
8.14% |
277.70 |
|
| White Collar Workers, Better-Off Multi Ethnic Areas |
0.00% |
4.02% |
0.00 |
|
| Older People, Less Prosperous Areas |
4.68% |
3.19% |
146.82 |
|
| Council Estate Residents, Better-Off Homes |
18.37% |
11.31% |
162.40 |
|
| Council Estate Residents, High Unemployment |
0.56% |
3.06% |
18.28 |
|
| Council Estate Residents, Greatest Hardship |
2.01% |
2.52% |
79.70 |
|
| People in Multi-Ethnic, Low-Income Areas |
0.00% |
2.10% |
0.00 |
|
| Unclassified |
0.00% |
0.06% |
0.00 |
|
|
 |
 |
 |
| £0-5K |
15.00% |
9.41% |
159.36 |
|
| £5-10K |
23.47% |
16.63% |
141.08 |
|
| £10-15K |
19.85% |
16.58% |
119.73 |
|
| £15-20K |
13.83% |
13.58% |
101.79 |
|
| £20-25K |
9.09% |
10.39% |
87.49 |
|
| £25-30K |
5.92% |
7.77% |
76.15 |
|
| £30-35K |
3.89% |
5.79% |
67.10 |
|
| £35-40K |
2.59% |
4.33% |
59.80 |
|
| £40-45K |
1.76% |
3.27% |
53.83 |
|
| £45-50K |
1.21% |
2.48% |
48.89 |
|
| £50-55K |
0.85% |
1.90% |
44.76 |
|
| £55-60K |
0.61% |
1.47% |
41.27 |
|
| £60-65K |
0.44% |
1.15% |
38.28 |
|
| £65-70K |
0.32% |
0.91% |
35.70 |
|
| £70-75K |
0.24% |
0.72% |
33.46 |
|
| £75-80K |
0.18% |
0.57% |
31.49 |
|
| £80-85K |
0.14% |
0.46% |
29.75 |
|
| £85-90K |
0.11% |
0.37% |
28.20 |
|
| £90-95K |
0.08% |
0.31% |
26.82 |
|
| £95-100K |
0.06% |
0.25% |
25.57 |
|
| £100K + |
0.27% |
1.34% |
20.12 |
|
|
|

|


|
1992-1997
|
1997-2001
|
|
|
|
| Con |
-5.91% |
| Lab |
0.25% |
| LD |
0.66% |
|
| Con |
0.99% |
| Lab |
-5.64% |
| LD |
5.50% |
|
|
 |
Jeff Ennis
Labour hold
|
| Con |
 |
4,024 |
12.38% |
| Lab |
 |
21,945 |
67.50% |
| LD |
 |
5,156 |
15.86% |
| Oth |
 |
1,384 |
4.26% |
| Maj |
 |
16,789 |
51.64% |
| Turn |
 |
32,509 |
49.51% |
|
|
 |
Jeff Ennis
Labour hold
|
| LD |
Sharron Brook |
5,156 |
15.86% |
| L |
Jeff Ennis |
21,945 |
67.50% |
| C |
Matthew Offord |
4,024 |
12.38% |
| SL |
Terry Robinson |
722 |
2.22% |
| UK |
George Savage |
662 |
2.04% |
|
Candidates representing 5 parties stood for election to this seat.
|
|
 |
Jeff Ennis
Labour
|
| Con |
 |
4,936 |
11.39% |
| Lab |
 |
31,699 |
73.15% |
| LD |
 |
4,489 |
10.36% |
| Ref |
 |
797 |
1.84% |
| Oth |
 |
1,414 |
3.26% |
| Maj |
 |
26,763 |
61.76% |
| Turn |
 |
43,335 |
63.88% |
|
|
 |
|
Labour
|
| Con |
 |
8,654 |
17.30% |
| Lab |
 |
36,375 |
72.90% |
| LD |
 |
4,864 |
9.70% |
| Oth |
|
0 |
0.00% |
| Maj |
 |
27,721 |
55.60% |
| Turn |
 |
49,893 |
72.22% |
|
|
 |
|

|

