|
Glasgow Maryhill
Labour hold

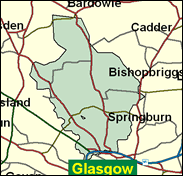
Yet another solid Glasgow Labour seat, set in the north of the city around Possil and Milton, and stretching to older territory on the north west fringes of the inner city at Woodside and north Kelvinside, and with among the 10 highest proportions of council housing in the UK (along with three other Glasgow constituencies), the only curiosity about Maryhill's result in 1997 was that it supplied the best result anywhere for the yogic Natural Law Party, which optimistically contested most of Britain's seats - 651 votes. This was not because of some special devotion to transcendental meditation in Maryhill, but more to the surname of the NLP candidate: Blair.

Ann McKechin has been selected to replace retiring Labour MP Maria Fyfe, only the second case of a woman replacing a retiring female Labour MP, and only the fourth woman to get selected in 36 Labour-held seat selections up to April this year, in her case assisted by an exceptional all-woman shortlist. A solicitor born in 1961, she was educated at Sacred Heart High School, Paisley, Paisley Grammar School, and Strathclyde University. A campaigner for aid and international debt relief, she comes from a traditional West of Scotland Catholic Labour background, with her father for 17 years a Labour councillor and herself currently Women's Officer of Glasgow Kelvin CLP.
 |
| Wealthy Achievers, Suburban Areas |
0.00% |
14.99% |
0.03 |
|
| Affluent Greys, Rural Communities |
0.00% |
2.13% |
0.00 |
|
| Prosperous Pensioners, Retirement Areas |
0.18% |
2.49% |
7.29 |
|
| Affluent Executives, Family Areas |
0.41% |
4.43% |
9.35 |
|
| Well-Off Workers, Family Areas |
1.57% |
7.27% |
21.57 |
|
| Affluent Urbanites, Town & City Areas |
2.88% |
2.56% |
112.22 |
|
| Prosperous Professionals, Metropolitan Areas |
1.61% |
2.04% |
79.09 |
|
| Better-Off Executives, Inner City Areas |
15.83% |
3.94% |
401.46 |
|
| Comfortable Middle Agers, Mature Home Owning Areas |
0.09% |
13.04% |
0.71 |
|
| Skilled Workers, Home Owning Areas |
1.38% |
12.70% |
10.90 |
|
| New Home Owners, Mature Communities |
1.54% |
8.14% |
18.90 |
|
| White Collar Workers, Better-Off Multi Ethnic Areas |
0.97% |
4.02% |
24.10 |
|
| Older People, Less Prosperous Areas |
2.70% |
3.19% |
84.80 |
|
| Council Estate Residents, Better-Off Homes |
13.89% |
11.31% |
122.84 |
|
| Council Estate Residents, High Unemployment |
33.19% |
3.06% |
1,083.94 |
|
| Council Estate Residents, Greatest Hardship |
20.87% |
2.52% |
828.64 |
|
| People in Multi-Ethnic, Low-Income Areas |
2.86% |
2.10% |
136.42 |
|
| Unclassified |
0.00% |
0.06% |
0.00 |
|
|
 |
 |
 |
| £0-5K |
16.92% |
9.41% |
179.78 |
|
| £5-10K |
23.06% |
16.63% |
138.64 |
|
| £10-15K |
18.78% |
16.58% |
113.27 |
|
| £15-20K |
13.06% |
13.58% |
96.16 |
|
| £20-25K |
8.71% |
10.39% |
83.83 |
|
| £25-30K |
5.79% |
7.77% |
74.51 |
|
| £30-35K |
3.89% |
5.79% |
67.22 |
|
| £35-40K |
2.66% |
4.33% |
61.39 |
|
| £40-45K |
1.85% |
3.27% |
56.63 |
|
| £45-50K |
1.31% |
2.48% |
52.70 |
|
| £50-55K |
0.94% |
1.90% |
49.42 |
|
| £55-60K |
0.69% |
1.47% |
46.65 |
|
| £60-65K |
0.51% |
1.15% |
44.29 |
|
| £65-70K |
0.38% |
0.91% |
42.27 |
|
| £70-75K |
0.29% |
0.72% |
40.53 |
|
| £75-80K |
0.22% |
0.57% |
39.02 |
|
| £80-85K |
0.17% |
0.46% |
37.71 |
|
| £85-90K |
0.14% |
0.37% |
36.56 |
|
| £90-95K |
0.11% |
0.31% |
35.54 |
|
| £95-100K |
0.09% |
0.25% |
34.65 |
|
| £100K + |
0.42% |
1.34% |
31.16 |
|
|
|

|


|
1992-1997
|
1997-2001
|
|
|
|
| Con |
-3.72% |
| Lab |
2.34% |
| LD |
0.43% |
| SNP |
-2.45% |
|
| Con |
-0.65% |
| Lab |
-4.57% |
| LD |
3.54% |
| SNP |
-1.06% |
|
|
 |
Ann McKechin
Labour hold
|
| Con |
 |
1,162 |
5.23% |
| Lab |
 |
13,420 |
60.37% |
| LD |
 |
2,372 |
10.67% |
| SNP |
 |
3,532 |
15.89% |
| Oth |
 |
1,745 |
7.85% |
| Maj |
 |
9,888 |
44.48% |
| Turn |
 |
22,231 |
40.10% |
|
|
 |
Ann McKechin
Labour hold
|
| LD |
Stuart Callison |
2,372 |
10.67% |
| SNP |
Alex Dingwall |
3,532 |
15.89% |
| L |
Ann McKechin |
13,420 |
60.37% |
| SSP |
Gordon Scott |
1,745 |
7.85% |
| C |
Gawain Towler |
1,162 |
5.23% |
|
Candidates representing 5 parties stood for election to this seat.
|
|
 |
Maria Fyfe
Labour
|
| Con |
 |
1,747 |
5.88% |
| Lab |
 |
19,301 |
64.94% |
| LD |
 |
2,119 |
7.13% |
| SNP |
 |
5,037 |
16.95% |
| Ref |
 |
77 |
0.26% |
| Oth |
 |
1,440 |
4.85% |
| Maj |
 |
14,264 |
47.99% |
| Turn |
 |
29,721 |
56.59% |
|
|
 |
|
Labour
|
| Con |
 |
3,241 |
9.60% |
| Lab |
 |
21,042 |
62.60% |
| LD |
 |
2,238 |
6.70% |
| SNP |
 |
6,530 |
19.40% |
| Oth |
 |
560 |
1.70% |
| Maj |
 |
14,512 |
43.20% |
| Turn |
 |
33,611 |
64.28% |
|
|
 |
|

|

