|
Glasgow Pollok
Labour hold

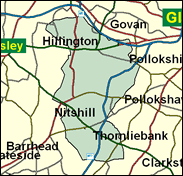
Tommy Sheridan of the Scottish Socialist Party obtained 21.5 per cent of the vote in Pollok in the Scottish Parliament elections of May 1999, to add to his 11 per cent for Westminster in 1997, and he was elected as a top up MSP for the city as a whole, a product of proportional representation's opportunities for small parties. Sheridan remained in the public eye; in December 2000 he was jailed for 14 days for civil disobedience, and served five in Barlinnie prison. However, despite Sheridan's potent and distinctive presence in the SSP's national campaign, in which it contests all 72 Scottish seats, he is not standing in theis constituency in 2001, and Labour's Ian Davidson is very likely to win Pollok again. It should be noted that the name of this seat, though frequently "corrected" to Pollock, is not a misprint. It is named after Pollok House and Pollok Park in south west Glasgow, around which this majority council house constituency is located.

Bald, bushy-moustached Ian Davidson, who was elected as a Glasgow MP (for Govan) in 1992 (when he ousted SNP's Jim Sillars), is a left-wing critic of Blairism who sought unsuccessfully to get onto the panel of approved candidates for the Scottish Parliament. A Eurosceptic who had worked for MEP Janey Buchan, he was an active rebel against Blair's leadership in opposition, but has been rather more circumspect since 1997, voting against the government on means testing of incapacity benefits, linking pensions to average earnings, and air traffic control sell-off.
 |
| Wealthy Achievers, Suburban Areas |
1.01% |
14.99% |
6.73 |
|
| Affluent Greys, Rural Communities |
0.00% |
2.13% |
0.00 |
|
| Prosperous Pensioners, Retirement Areas |
0.05% |
2.49% |
1.86 |
|
| Affluent Executives, Family Areas |
3.09% |
4.43% |
69.94 |
|
| Well-Off Workers, Family Areas |
6.91% |
7.27% |
94.94 |
|
| Affluent Urbanites, Town & City Areas |
4.06% |
2.56% |
158.20 |
|
| Prosperous Professionals, Metropolitan Areas |
0.00% |
2.04% |
0.00 |
|
| Better-Off Executives, Inner City Areas |
1.75% |
3.94% |
44.32 |
|
| Comfortable Middle Agers, Mature Home Owning Areas |
1.29% |
13.04% |
9.86 |
|
| Skilled Workers, Home Owning Areas |
5.40% |
12.70% |
42.54 |
|
| New Home Owners, Mature Communities |
3.05% |
8.14% |
37.46 |
|
| White Collar Workers, Better-Off Multi Ethnic Areas |
0.35% |
4.02% |
8.62 |
|
| Older People, Less Prosperous Areas |
6.51% |
3.19% |
204.45 |
|
| Council Estate Residents, Better-Off Homes |
21.40% |
11.31% |
189.21 |
|
| Council Estate Residents, High Unemployment |
18.90% |
3.06% |
617.08 |
|
| Council Estate Residents, Greatest Hardship |
26.13% |
2.52% |
1,037.60 |
|
| People in Multi-Ethnic, Low-Income Areas |
0.11% |
2.10% |
5.30 |
|
| Unclassified |
0.00% |
0.06% |
0.00 |
|
|
 |
 |
 |
| £0-5K |
16.05% |
9.41% |
170.47 |
|
| £5-10K |
22.68% |
16.63% |
136.37 |
|
| £10-15K |
19.09% |
16.58% |
115.15 |
|
| £15-20K |
13.59% |
13.58% |
100.04 |
|
| £20-25K |
9.18% |
10.39% |
88.29 |
|
| £25-30K |
6.11% |
7.77% |
78.62 |
|
| £30-35K |
4.08% |
5.79% |
70.41 |
|
| £35-40K |
2.74% |
4.33% |
63.34 |
|
| £40-45K |
1.87% |
3.27% |
57.19 |
|
| £45-50K |
1.29% |
2.48% |
51.81 |
|
| £50-55K |
0.90% |
1.90% |
47.10 |
|
| £55-60K |
0.63% |
1.47% |
42.96 |
|
| £60-65K |
0.45% |
1.15% |
39.31 |
|
| £65-70K |
0.33% |
0.91% |
36.08 |
|
| £70-75K |
0.24% |
0.72% |
33.23 |
|
| £75-80K |
0.18% |
0.57% |
30.69 |
|
| £80-85K |
0.13% |
0.46% |
28.43 |
|
| £85-90K |
0.10% |
0.37% |
26.41 |
|
| £90-95K |
0.08% |
0.31% |
24.60 |
|
| £95-100K |
0.06% |
0.25% |
22.97 |
|
| £100K + |
0.22% |
1.34% |
16.19 |
|
|
|

|


|
1992-1997
|
1997-2001
|
|
|
|
| Con |
-2.17% |
| Lab |
10.01% |
| LD |
-0.83% |
| SNP |
-7.13% |
|
| Con |
-0.43% |
| Lab |
1.39% |
| LD |
2.91% |
| SNP |
-1.14% |
|
|
 |
Ian Davidson
Labour hold
|
| Con |
 |
1,417 |
5.61% |
| Lab |
 |
15,497 |
61.31% |
| LD |
 |
1,612 |
6.38% |
| SNP |
 |
4,229 |
16.73% |
| Oth |
 |
2,522 |
9.98% |
| Maj |
 |
11,268 |
44.58% |
| Turn |
 |
25,277 |
51.37% |
|
|
 |
Ian Davidson
Labour hold
|
| SSP |
Keith Baldesara |
2,522 |
9.98% |
| LC |
Ian Davidson |
15,497 |
61.31% |
| LD |
Isabel Nelson |
1,612 |
6.38% |
| C |
Rory O'Brien |
1,417 |
5.61% |
| SNP |
David Ritchie |
4,229 |
16.73% |
|
Candidates representing 5 parties stood for election to this seat.
|
|
 |
Ian Davidson
Labour
|
| Con |
 |
1,979 |
6.03% |
| Lab |
 |
19,653 |
59.91% |
| LD |
 |
1,137 |
3.47% |
| SNP |
 |
5,862 |
17.87% |
| Ref |
 |
152 |
0.46% |
| Oth |
 |
4,019 |
12.25% |
| Maj |
 |
13,791 |
42.04% |
| Turn |
 |
32,802 |
66.56% |
|
|
 |
|
Labour
|
| Con |
 |
3,107 |
8.20% |
| Lab |
 |
18,945 |
49.90% |
| LD |
 |
1,648 |
4.30% |
| SNP |
 |
9,492 |
25.00% |
| Oth |
 |
4,811 |
12.70% |
| Maj |
 |
9,453 |
24.90% |
| Turn |
 |
38,003 |
72.14% |
|
|
 |
|

|

