|
Glasgow Rutherglen
Labour hold

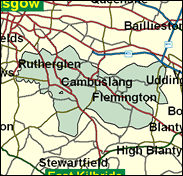
Once a separate burgh to the south east of Glasgow, Rutherglen has been included in a Glasgow constituency since the early 1970s. Its politics have also converged with those of that near one-party (Labour) state, as an old tendency to Liberal preference from the 1980s was not sustained in the 1990s, although they finished in a strongish third place in both the 1997 General Election and for the 1999 Scottish Parliament.

Tommy McAvoy is one of Labour's silent hewers of wood and drawers of water, as a Whip, by 1997 third in seniority as the Pairing Whip. Born 1943 and Catholic-secondary-school-educated, he was a sometime storeman and fork lift truck driver, who served a short, five-year apprenticeship on Strathclyde Council before reaching Westminster in 1987, where, as a Catholic, he follows his church on low abortion limits.
 |
| Wealthy Achievers, Suburban Areas |
4.49% |
14.99% |
29.94 |
|
| Affluent Greys, Rural Communities |
0.00% |
2.13% |
0.00 |
|
| Prosperous Pensioners, Retirement Areas |
1.18% |
2.49% |
47.52 |
|
| Affluent Executives, Family Areas |
1.35% |
4.43% |
30.54 |
|
| Well-Off Workers, Family Areas |
9.45% |
7.27% |
129.91 |
|
| Affluent Urbanites, Town & City Areas |
8.37% |
2.56% |
326.31 |
|
| Prosperous Professionals, Metropolitan Areas |
0.31% |
2.04% |
15.32 |
|
| Better-Off Executives, Inner City Areas |
1.48% |
3.94% |
37.56 |
|
| Comfortable Middle Agers, Mature Home Owning Areas |
6.61% |
13.04% |
50.70 |
|
| Skilled Workers, Home Owning Areas |
5.34% |
12.70% |
42.05 |
|
| New Home Owners, Mature Communities |
2.85% |
8.14% |
35.00 |
|
| White Collar Workers, Better-Off Multi Ethnic Areas |
1.50% |
4.02% |
37.37 |
|
| Older People, Less Prosperous Areas |
6.56% |
3.19% |
205.81 |
|
| Council Estate Residents, Better-Off Homes |
18.38% |
11.31% |
162.54 |
|
| Council Estate Residents, High Unemployment |
20.22% |
3.06% |
660.17 |
|
| Council Estate Residents, Greatest Hardship |
11.90% |
2.52% |
472.68 |
|
| People in Multi-Ethnic, Low-Income Areas |
0.00% |
2.10% |
0.00 |
|
| Unclassified |
0.00% |
0.06% |
0.00 |
|
|
 |
 |
 |
| £0-5K |
12.30% |
9.41% |
130.71 |
|
| £5-10K |
19.44% |
16.63% |
116.90 |
|
| £10-15K |
17.99% |
16.58% |
108.53 |
|
| £15-20K |
13.87% |
13.58% |
102.12 |
|
| £20-25K |
10.03% |
10.39% |
96.52 |
|
| £25-30K |
7.11% |
7.77% |
91.49 |
|
| £30-35K |
5.04% |
5.79% |
86.97 |
|
| £35-40K |
3.59% |
4.33% |
82.94 |
|
| £40-45K |
2.59% |
3.27% |
79.35 |
|
| £45-50K |
1.89% |
2.48% |
76.15 |
|
| £50-55K |
1.40% |
1.90% |
73.28 |
|
| £55-60K |
1.04% |
1.47% |
70.69 |
|
| £60-65K |
0.79% |
1.15% |
68.34 |
|
| £65-70K |
0.60% |
0.91% |
66.18 |
|
| £70-75K |
0.46% |
0.72% |
64.18 |
|
| £75-80K |
0.36% |
0.57% |
62.32 |
|
| £80-85K |
0.28% |
0.46% |
60.58 |
|
| £85-90K |
0.22% |
0.37% |
58.94 |
|
| £90-95K |
0.18% |
0.31% |
57.38 |
|
| £95-100K |
0.14% |
0.25% |
55.90 |
|
| £100K + |
0.64% |
1.34% |
47.56 |
|
|
|

|


|
1992-1997
|
1997-2001
|
|
|
|
| Con |
-9.94% |
| Lab |
4.12% |
| LD |
2.85% |
| SNP |
-0.33% |
|
| Con |
2.04% |
| Lab |
-0.14% |
| LD |
-1.92% |
| SNP |
-1.11% |
|
|
 |
Thomas McAvoy
Labour hold
|
| Con |
 |
3,301 |
11.30% |
| Lab |
 |
16,760 |
57.37% |
| LD |
 |
3,689 |
12.63% |
| SNP |
 |
4,135 |
14.15% |
| Oth |
 |
1,328 |
4.55% |
| Maj |
 |
12,625 |
43.22% |
| Turn |
 |
29,213 |
56.34% |
|
|
 |
Thomas McAvoy
Labour hold
|
| SSP |
Bill Bonnar |
1,328 |
4.55% |
| LD |
David Jackson |
3,689 |
12.63% |
| C |
Malcolm Macaskill |
3,301 |
11.30% |
| L |
Thomas McAvoy |
16,760 |
57.37% |
| SNP |
Anne McLaughlin |
4,135 |
14.15% |
|
Candidates representing 5 parties stood for election to this seat.
|
|
 |
Thomas McAvoy
Labour
|
| Con |
 |
3,288 |
9.26% |
| Lab |
 |
20,430 |
57.52% |
| LD |
 |
5,167 |
14.55% |
| SNP |
 |
5,423 |
15.27% |
| Ref |
 |
150 |
0.42% |
| Oth |
 |
1,063 |
2.99% |
| Maj |
 |
15,007 |
42.25% |
| Turn |
 |
35,521 |
70.14% |
|
|
 |
|
Labour
|
| Con |
 |
7,443 |
19.20% |
| Lab |
 |
20,742 |
53.40% |
| LD |
 |
4,529 |
11.70% |
| SNP |
 |
6,052 |
15.60% |
| Oth |
 |
92 |
0.20% |
| Maj |
 |
13,299 |
34.20% |
| Turn |
 |
38,858 |
74.35% |
|
|
 |
|

|

