|
Glasgow Shettleston
Labour hold

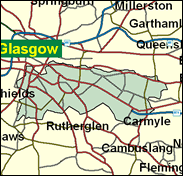
One of the safest of all Labour seats in Scotland, as shown by their 27 per cent majority over the SNP even in the Scottish Parliament elections of 1999, this is the inner-east seat of Glasgow, which now extends from Parkhead, the home of Celtic FC, well south of the Clyde to include famous but now depopulated neighbourhoods like the Gorbals.

David Marshall is another low-profile Glaswegian Labour MP with all the usual accoutrements: a manual working past, in his case as a bus conductor, a spell on the local (Strathclyde) council, and a conservative (though in this case not Catholic driven) line on homosexuality and abortion. Disappeared into Commons committee chairmanships, he was born 1941 and educated at various high schools in Larbert, Falkirk, and Glasgow and can be counted a safe pair of chins.
 |
| Wealthy Achievers, Suburban Areas |
0.16% |
14.99% |
1.08 |
|
| Affluent Greys, Rural Communities |
0.00% |
2.13% |
0.00 |
|
| Prosperous Pensioners, Retirement Areas |
0.00% |
2.49% |
0.00 |
|
| Affluent Executives, Family Areas |
0.08% |
4.43% |
1.80 |
|
| Well-Off Workers, Family Areas |
1.85% |
7.27% |
25.43 |
|
| Affluent Urbanites, Town & City Areas |
2.81% |
2.56% |
109.68 |
|
| Prosperous Professionals, Metropolitan Areas |
0.43% |
2.04% |
21.12 |
|
| Better-Off Executives, Inner City Areas |
6.20% |
3.94% |
157.12 |
|
| Comfortable Middle Agers, Mature Home Owning Areas |
1.40% |
13.04% |
10.73 |
|
| Skilled Workers, Home Owning Areas |
1.98% |
12.70% |
15.62 |
|
| New Home Owners, Mature Communities |
0.70% |
8.14% |
8.56 |
|
| White Collar Workers, Better-Off Multi Ethnic Areas |
0.64% |
4.02% |
15.81 |
|
| Older People, Less Prosperous Areas |
3.47% |
3.19% |
109.04 |
|
| Council Estate Residents, Better-Off Homes |
5.97% |
11.31% |
52.77 |
|
| Council Estate Residents, High Unemployment |
53.04% |
3.06% |
1,732.11 |
|
| Council Estate Residents, Greatest Hardship |
19.11% |
2.52% |
758.65 |
|
| People in Multi-Ethnic, Low-Income Areas |
2.16% |
2.10% |
103.01 |
|
| Unclassified |
0.00% |
0.06% |
0.00 |
|
|
 |
 |
 |
| £0-5K |
17.92% |
9.41% |
190.39 |
|
| £5-10K |
23.79% |
16.63% |
143.04 |
|
| £10-15K |
19.25% |
16.58% |
116.11 |
|
| £15-20K |
13.22% |
13.58% |
97.32 |
|
| £20-25K |
8.64% |
10.39% |
83.16 |
|
| £25-30K |
5.60% |
7.77% |
72.02 |
|
| £30-35K |
3.65% |
5.79% |
63.01 |
|
| £35-40K |
2.41% |
4.33% |
55.61 |
|
| £40-45K |
1.61% |
3.27% |
49.46 |
|
| £45-50K |
1.10% |
2.48% |
44.29 |
|
| £50-55K |
0.76% |
1.90% |
39.92 |
|
| £55-60K |
0.53% |
1.47% |
36.20 |
|
| £60-65K |
0.38% |
1.15% |
33.01 |
|
| £65-70K |
0.27% |
0.91% |
30.25 |
|
| £70-75K |
0.20% |
0.72% |
27.87 |
|
| £75-80K |
0.15% |
0.57% |
25.79 |
|
| £80-85K |
0.11% |
0.46% |
23.96 |
|
| £85-90K |
0.08% |
0.37% |
22.36 |
|
| £90-95K |
0.06% |
0.31% |
20.94 |
|
| £95-100K |
0.05% |
0.25% |
19.69 |
|
| £100K + |
0.20% |
1.34% |
14.64 |
|
|
|

|


|
1992-1997
|
1997-2001
|
|
|
|
| Con |
-6.67% |
| Lab |
7.66% |
| LD |
-2.14% |
| SNP |
-2.22% |
|
| Con |
-0.25% |
| Lab |
-8.49% |
| LD |
1.44% |
| SNP |
2.72% |
|
|
 |
David Marshall
Labour hold
|
| Con |
 |
1,082 |
5.29% |
| Lab |
 |
13,235 |
64.67% |
| LD |
 |
1,105 |
5.40% |
| SNP |
 |
3,417 |
16.70% |
| Oth |
 |
1,626 |
7.95% |
| Maj |
 |
9,818 |
47.97% |
| Turn |
 |
20,465 |
39.69% |
|
|
 |
David Marshall
Labour hold
|
| SNP |
Jim Byrne |
3,417 |
16.70% |
| LD |
Lewis Hutton |
1,105 |
5.40% |
| SSP |
Rosie Kane |
1,396 |
6.82% |
| L |
David Marshall |
13,235 |
64.67% |
| C |
Campell Murdoch |
1,082 |
5.29% |
| SL |
Murdo Ritchie |
230 |
1.12% |
|
Candidates representing 6 parties stood for election to this seat.
|
|
 |
David Marshall
Labour
|
| Con |
 |
1,484 |
5.53% |
| Lab |
 |
19,616 |
73.16% |
| LD |
 |
1,061 |
3.96% |
| SNP |
 |
3,748 |
13.98% |
| Ref |
 |
151 |
0.56% |
| Oth |
 |
753 |
2.81% |
| Maj |
 |
15,868 |
59.18% |
| Turn |
 |
26,813 |
55.87% |
|
|
 |
|
Labour
|
| Con |
 |
3,876 |
12.20% |
| Lab |
 |
20,767 |
65.50% |
| LD |
 |
1,939 |
6.10% |
| SNP |
 |
5,123 |
16.20% |
| Oth |
|
0 |
0.00% |
| Maj |
 |
15,644 |
49.30% |
| Turn |
 |
31,705 |
64.23% |
|
|
 |
|

|

