|
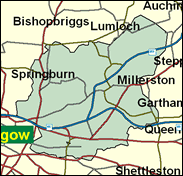
Glasgow Springburn
Labour hold

The Labour MP for Glasgow Springburn was chosen from an unprecedented double-figure number of candidates to succeed Betty Bothroyd as Speaker of the Commons in October 2000. This technically marks a break in Labour's monopoly of MPs in the largest Scottish city, as Mr Martin will be returned under a non-partisan label in future General Elections.

Michael Martin, hunched and pleasantly moon-faced, was rocketed to national prominence by his buggins-turn-but-controversial election as Speaker in 2000. The first Catholic Speaker since Sir Thomas More, he is also the first sheet metal worker to become Speaker, and the first Speaker to render the traditional Glaswegian interrogative "Are you looking at me, Jimmy?" into a perfectly respectable form of Commons enquiry. He may additionally be the first Speaker whose instructions - for added clarity - could well do with being sprayed above the proscenium arch. Born in 1945, he attended St Patrick's (RC) Boys' School, Glasgow and reached Westminster in 1979 after an obligatory stint on Glasgow council. He has voted the Catholic ticket on abortion and homosexuality, and antagonised the journalists by ousting them from the Commons' terrace.
 |
| Wealthy Achievers, Suburban Areas |
0.00% |
14.99% |
0.00 |
|
| Affluent Greys, Rural Communities |
0.00% |
2.13% |
0.00 |
|
| Prosperous Pensioners, Retirement Areas |
0.00% |
2.49% |
0.00 |
|
| Affluent Executives, Family Areas |
2.30% |
4.43% |
52.02 |
|
| Well-Off Workers, Family Areas |
3.84% |
7.27% |
52.74 |
|
| Affluent Urbanites, Town & City Areas |
5.26% |
2.56% |
205.11 |
|
| Prosperous Professionals, Metropolitan Areas |
0.00% |
2.04% |
0.00 |
|
| Better-Off Executives, Inner City Areas |
3.24% |
3.94% |
82.23 |
|
| Comfortable Middle Agers, Mature Home Owning Areas |
0.28% |
13.04% |
2.12 |
|
| Skilled Workers, Home Owning Areas |
1.52% |
12.70% |
11.95 |
|
| New Home Owners, Mature Communities |
2.44% |
8.14% |
29.94 |
|
| White Collar Workers, Better-Off Multi Ethnic Areas |
1.25% |
4.02% |
31.04 |
|
| Older People, Less Prosperous Areas |
3.73% |
3.19% |
117.11 |
|
| Council Estate Residents, Better-Off Homes |
17.53% |
11.31% |
154.98 |
|
| Council Estate Residents, High Unemployment |
37.03% |
3.06% |
1,209.35 |
|
| Council Estate Residents, Greatest Hardship |
21.44% |
2.52% |
851.35 |
|
| People in Multi-Ethnic, Low-Income Areas |
0.14% |
2.10% |
6.88 |
|
| Unclassified |
0.00% |
0.06% |
0.00 |
|
|
 |
 |
 |
| £0-5K |
17.87% |
9.41% |
189.86 |
|
| £5-10K |
24.09% |
16.63% |
144.81 |
|
| £10-15K |
19.24% |
16.58% |
116.03 |
|
| £15-20K |
13.07% |
13.58% |
96.22 |
|
| £20-25K |
8.50% |
10.39% |
81.82 |
|
| £25-30K |
5.51% |
7.77% |
70.90 |
|
| £30-35K |
3.61% |
5.79% |
62.35 |
|
| £35-40K |
2.40% |
4.33% |
55.49 |
|
| £40-45K |
1.63% |
3.27% |
49.86 |
|
| £45-50K |
1.12% |
2.48% |
45.15 |
|
| £50-55K |
0.78% |
1.90% |
41.17 |
|
| £55-60K |
0.56% |
1.47% |
37.75 |
|
| £60-65K |
0.40% |
1.15% |
34.79 |
|
| £65-70K |
0.29% |
0.91% |
32.20 |
|
| £70-75K |
0.22% |
0.72% |
29.91 |
|
| £75-80K |
0.16% |
0.57% |
27.87 |
|
| £80-85K |
0.12% |
0.46% |
26.06 |
|
| £85-90K |
0.09% |
0.37% |
24.42 |
|
| £90-95K |
0.07% |
0.31% |
22.95 |
|
| £95-100K |
0.05% |
0.25% |
21.61 |
|
| £100K + |
0.21% |
1.34% |
15.74 |
|
|
|

|


|
1992-1997
|
1997-2001
|
|
|
|
| Con |
-4.91% |
| Lab |
6.46% |
| LD |
-0.03% |
| SNP |
-3.41% |
|
| Con |
-5.99% |
| Lab |
-4.76% |
| LD |
-4.27% |
| SNP |
2.90% |
|
|
 |
Michael Martin
Labour hold
|
| Con |
|
0 |
0.00% |
| Lab |
 |
16,053 |
66.60% |
| LD |
|
0 |
0.00% |
| SNP |
 |
4,675 |
19.40% |
| Oth |
 |
3,376 |
14.01% |
| Maj |
 |
11,378 |
47.20% |
| Turn |
 |
24,104 |
43.67% |
|
|
 |
Michael Martin
Labour hold
|
| SNP |
Sandy Bain |
4,675 |
19.40% |
| Scot U |
Daniel Houston |
1,289 |
5.35% |
| SSP |
Carolyn Leckie |
1,879 |
7.80% |
| Speaker |
Michael Martin |
16,053 |
66.60% |
| I |
Richard Silvester |
208 |
0.86% |
|
Candidates representing 5 parties stood for election to this seat.
|
|
 |
Michael Martin
Labour
|
| Con |
 |
1,893 |
5.99% |
| Lab |
 |
22,534 |
71.36% |
| LD |
 |
1,349 |
4.27% |
| SNP |
 |
5,208 |
16.49% |
| Ref |
 |
186 |
0.59% |
| Oth |
 |
407 |
1.29% |
| Maj |
 |
17,326 |
54.87% |
| Turn |
 |
31,577 |
59.05% |
|
|
 |
|
Labour
|
| Con |
 |
3,909 |
10.90% |
| Lab |
 |
23,347 |
64.90% |
| LD |
 |
1,559 |
4.30% |
| SNP |
 |
7,150 |
19.90% |
| Oth |
|
0 |
0.00% |
| Maj |
 |
16,197 |
45.00% |
| Turn |
 |
35,965 |
65.60% |
|
|
 |
|

|

